“Follow the Flush” with a Free Tour!

Narragansett Bay Commission Offers Free Clean Water Tours: Follow the Flush!

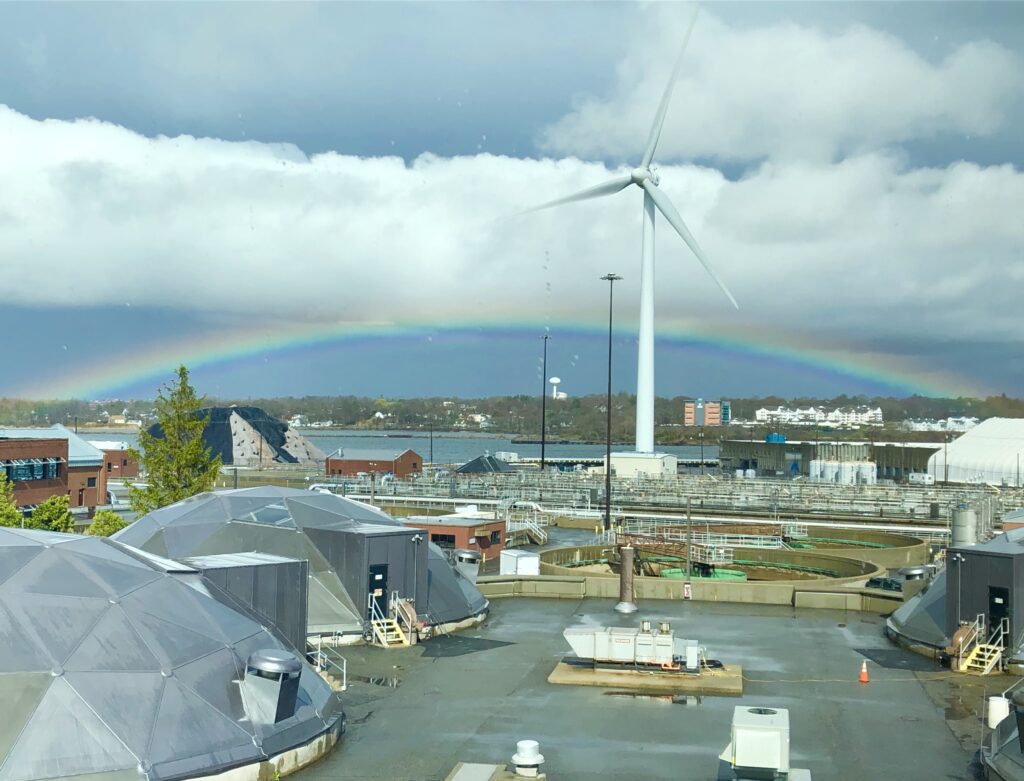
In celebration of Rhode Island Clean Water Week, the Narragansett Bay Commission (NBC) will offer free public tours of its award-winning Field’s Point Wastewater Treatment Facility in Providence on Saturday, April 12 from 10:00 AM to 1:00 PM.

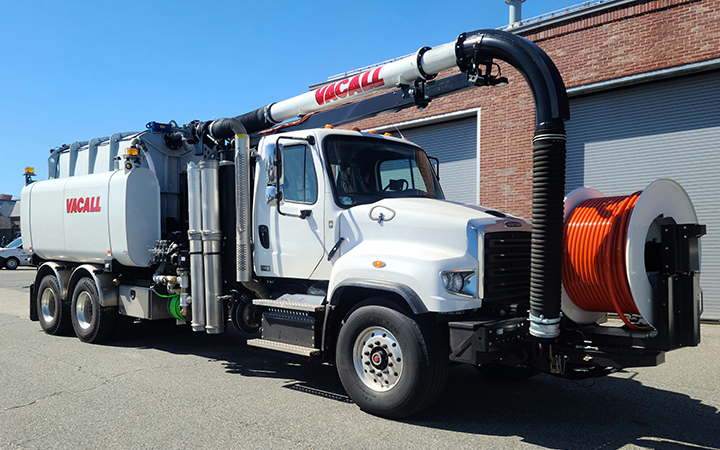
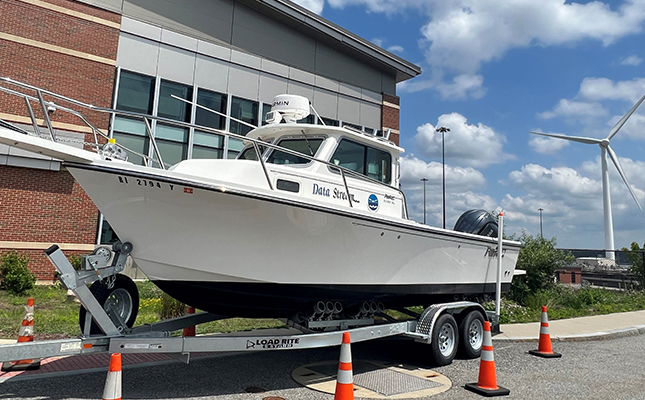
The tours will include a look at the region’s most sophisticated water quality lab, “touch-a-truck” and “touch-a-boat” with the NBC’s maintenance and research vehicles, a clean water scavenger hunt, and other fun activities.

“This facility is simultaneously one of the oldest and most advanced clean water facilities in the nation,” said NBC Chairman Vincent Mesolella. “We’re so excited to give the public the opportunity to ‘follow the flush’ and view the process that has made Narragansett Bay cleaner than it has been in 150 years.”

In addition, the NBC will issue certificates of completion to all students who take the tour that may be redeemed for extra credit at school (but students are advised check with their teacher first).

“I am confident that anyone who experiences this tour will be amazed and appreciative by the clean water efforts in our community,” Mesolella added.

Members of the public can book a tour on the half hours between 10:00 AM and 1:00 PM by emailing nbcpr@narrabay.com. Spaces are limited. The tour will take approximately 90 minutes.

The NBC joins four other clean water agencies in Rhode Island offering free public tours during Rhode Island Clean Water Week. Information on other tours is available at ricwa.org

July 2, 2025

On July 2nd, 2025, twenty stations were sampled for fecal coliform bacteria in the Providence and Seekonk Rivers; five of these stations were also sampled for enterococci bacteria. In the five days prior to sampling, 0.02 inches of precipitation was recorded at TF Green. Overall bacteria counts were higher than during the previous sampling event.

Fecal coliform counts were higher in the Seekonk River, compared to the Providence River (geometric mean of 4916 MPN/100 mL for the Seekonk River compared to 49 MPN/100mL for the Providence River) for sampling conducted on July 2nd. The maximum count (240,000 MPN/100 mL) was measured at the Point St. Bridge sampling location.

Fecal coliform counts were higher in the Providence River, compared to the previous sampling on June 4th (geometric mean of 49 MPN/100 mL compared to 30 MPN/100 mL on 6/4). Fecal coliform counts were higher in the Seekonk River, compared to the previous sampling on June 4th (geometric mean of 4916 MPN/100 mL compared to 93 MPN/100 mL on 6/4). 

Enterococci results had an overall geometric mean of 333 MPN/100 mL. Enterococci counts ranged from <10 MPN/100 mL at Conimicut Point and Gaspee Point to 6488 MPN/100 mL at Point St Bridge.

The next scheduled sampling date is July 16th.

​The table below lists the Rhode Island bacteria standards for primary contact and shellfishing established by the Rhode Island Department of Environmental Management (RIDEM). RIDEM defines primary contact as any recreational activities in which there is prolonged and intimate contact with water, involving considerable risk of ingesting water (e.g., swimming, diving, water skiing and surfing). Please note that the RIDEM bacteria standards are provided here for informational purposes only and are not intended to indicate official state compliance with primary contact or shellfishing standards.

Summary of Rhode Island Bacteria Standards for Saltwater Primary Contact and Shellfishing

 ​​​Fec​al Co​li​fo​r​mEnterococci
Primary
Con​​​t​a​c​t1​​​​​
Geom​e​tric ​m​e​a​n​ ≤50​ MPN/1​​00​ mL​
<10% ​o​f​​ samples >4​00 MPN/100 ​mL
Geom​etric mean ≤35 colo​nies​/100 mL​
All sa​mples ≤104 colonies/100 ​​mL2
ShellfishingGeometr​ic mean ≤14 MPN/100​ mL
<10% of samples >49 MPN/100 mL3​
NO ENTEROCOCCI CR​ITERIA​

1Fecal coliform primary contact criteria app​lied only when adequate enterococci data are not available; 2Single sample maximum criterion for determining beach swimming advisories at designated beaches as evaluated by the Rhode Island Department of Health; 3For a three-tube decimal dilution.

Table adapted from Rhode Island Water Quality Regulations (250-RICR-150-05-1)​; see regulations for complete details.​​​​​​​​​​

July 8, 2025

Water clarity was measured at eight locations in the Providence River and Seekonk River estuaries on July 8, 2025. In the five days prior to the survey, 0.55 inches of precipitation were recorded at TF Green. Secchi depth averaged 2.3 meters. The lowest clarity this week (1.3 meters) was measured at Phillipsdale Landing, while the greatest clarity (3.7 meters) was measured at Conimicut Point. There was a general north-to-south trend of increasing water clarity among the sites this week. Overall, water clarity remained approximately the same from the previous measurements (data collected July 2, 2025).

July 2, 2025

​Water clarity was measured at eight locations in the Providence River and Seekonk River estuaries on July 2, 2025. In the five days prior to the survey, 0.02 inches of precipitation were recorded at TF Green. Secchi depth averaged 2.2 meters. The lowest clarity this week (1.4 meters) was measured at Phillipsdale Landing, while the greatest clarity (2.9 meters) was measured at Conimicut Point. There was a general north-to-south trend of increasing water clarity among the sites this week. Overall, water clarity remained approximately the same from the previous measurements (data collected June 25, 2025).

May 28, 2025

Nutrient samples were collected from fourteen river stations and eight bay stations on May 28th. All bay stations were sampled at the surface and one station (Edgewood Shoal) was sampled at the bottom. In the five days prior to sampling, 0.06 inches of precipitation were recorded at T.F. Green. 

Among the river stations sampled, the highest total nitrogen (TN), total dissolved nitrogen (TDN), and dissolved inorganic nitrogen (DIN) were observed Ten Mile River @ Central Ave. (TN = 1,050 ppb, TDN = 1,100 ppb, DIN = 757). The lowest TN, and TDN were observed at Moshassuck River @ Higginson Ave. (TN = 458 ppb, TDN = 552 ppb). The lowest DIN was observed at Coles River @ Milford Rd. (DIN = 116 ppb).

Among the bay stations sampled, the highest surface total nitrogen (TN) was observed at Phillipsdale Landing (TN = 870 ppb). The highest total dissolved nitrogen (TDN), and dissolved inorganic nitrogen (DIN) were observed at Pawtuxet Cove (TDN = 771 ppb, DIN = 568 ppb). The lowest surface TN was observed at the Bullock Reach Buoy (TN = 584). The lowest surface TDN and DIN concentrations were observed at Conimicut Point (TDN = 214 ppb, DIN = 72 ppb).

The next scheduled sampling date is June 11, 2025.

May 14, 2025

Nutrient samples were collected from seven river stations and seven bay stations on May 14th. All bay stations were sampled at the surface and the bottom. In the five days prior to sampling, 0.29 inches of precipitation were recorded at T.F. Green. 

Among the river stations sampled, the highest total nitrogen (TN) was observed at Blackstone River @ Bikepath Bridge. (TN = 823 ppb). The highest total dissolved nitrogen (TDN) was observed at Blackstone River @ Slater Mill (TDN = 993 ppb). The highest dissolved inorganic nitrogen was observed at Pawtuxet River @ Broad St. (DIN = 520 ppb). The lowest TN, and DIN were observed at the Moshassuck River @ Footbridge at Mill St. (TN = 636 ppb, DIN = 683 ppb). The lowest TDN was observed at Blackstone River @ Stateline (TDN 428 ppb).

Among the bay stations sampled, the highest surface total nitrogen (TN) was observed at India Point Park (TN = 857 ppb). The highest total dissolved nitrogen (TDN) was observed at Phillipsdale Landing (TDN = 736 ppb). The highest dissolved inorganic nitrogen (DIN) was observed at Pawtuxet Cove (DIN = 453 ppb). The lowest surface TN, TDN and DIN concentrations were observed at Conimicut Point (TN = 645 ppb, TDN = 359 ppb, DIN = 183 ppb).

The next scheduled sampling date is May 28, 2025.

April 30, 2025

Nutrient samples were collected from seven river stations April 30th. In the five days prior to sampling, 0.76 inches of precipitation were recorded at T.F. Green. 

The highest total nitrogen (TN), total dissolved nitrogen (TDN) and dissolved inorganic nitrogen (DIN) concentrations were observed at Pawtuxet River @ Broad St. (TN = 1,120 ppb, TDN = 1,100 ppb, DIN = 875 ppb). The lowest TN, TDN and DIN concentrations were observed at Moshassuck River @ Footbridge at Mill St. (TN =670 ppb, TDN = 722 ppb, DIN = 427 ppb).

The next scheduled sampling date is May 14, 2025.

April 16-17, 2025

Nutrient samples were collected from seven river stations on April 16th and seven bay stations 17th. All bay stations were sampled at the surface and bottom except for one station (India Point Park) which was only sampled at the surface. In the five days prior to sampling, 0.80 inches of precipitation were recorded at T.F. Green. Due to a laboratory issue, some ammonia and dissolved inorganic nitrogen (DIN) results for the bay and river samples are not available. The DIN for both the bay and river stations will be based on the results available.

Among the river stations sampled, the highest total nitrogen (TN) was observed at Blackstone River @ Slater Mill (TN = 953 ppb). The highest total dissolved nitrogen (TDN) and dissolved inorganic nitrogen (DIN) was observed at Pawtuxet River @ Broad St. (TDN = 930 ppb, DIN = 673 ppb). The lowest TN and TDN were observed at Moshassuck River @ Footbridge at Mill St. (TN = 569 ppb, TDN = 517 ppb). The lowest DIN was observed at Blackstone River @ Bikepath Bridge. (DIN = 614 ppb).

Among the bay stations sampled, the highest surface total nitrogen (TN), total dissolved nitrogen (TDN), and dissolved inorganic nitrogen (DIN) were observed at Phillipsdale Landing (TN = 1,250 ppb, TDN = 975  ppb, DIN = 801 ppb). The lowest surface TN and DIN concentrations were observed at Conimicut Point (TN = 504 ppb, DIN = 79 ppb). The lowest surface TDN was observed at the Bullock Reach Buoy (TDN = 178 ppb).

The next scheduled sampling date is April 30, 2025.

April 2, 2025

Nutrient samples were collected from twelve river stations on April 2nd. In the five days prior to sampling, 0.25 inches of precipitation were recorded at T.F. Green. 

The highest total nitrogen (TN), total dissolved nitrogen (TDN), and dissolved inorganic nitrogen (DIN) were observed at Ten Mile River @ Central Ave. (TN = 2,040 ppb, TDN = 2,020 ppb, DIN = 1,731). The lowest TN, and TDN concentrations were observed at Moshassuck River @ Footbridge at Mill St. (TN = 546 ppb, TDN = 543 ppb). The lowest DIN concentration was observed at Coles River @ Milford Rd. (DIN = 160 ppb).

The next scheduled sampling date is April 16, 2025.

March 19, 2025

Nutrient samples were collected from seven river stations and eight bay stations on March 19th. All bay stations were sampled at the surface and the bottom. In the five days prior to sampling, 2.21 inches of precipitation were recorded at T.F. Green. 

Among the river stations sampled, the highest total nitrogen (TN), total dissolved nitrogen (TDN) and dissolved inorganic nitrogen (DIN) were observed at Blackstone River @ Slater Mill (TN = 1,220 ppb, TDN = 1,160, DIN = 810). The lowest TN, and TDN concentrations were observed on the Woonasquatucket River @ Manton Ave. Bridge (TN = 624 ppb, TDN = 617 ppb). The lowest DIN was observed at Moshassuck River @ Footbridge at Mill St. (DIN = 407 ppb).

Among the bay stations sampled, the highest surface total nitrogen (TN), total dissolved nitrogen (TDN), and dissolved inorganic nitrogen (DIN) were observed at Phillipsdale Landing (TN = 1,450 ppb, TDN = 1,290 ppb, DIN = 889 ppb). The lowest surface TN was observed at Pomham Rocks (TN = 766 ppb). The lowest surface TDN and DIN concentrations were observed at Conimicut Point Surface (TDN = 475 ppb, DIN = 223 ppb).

The next scheduled sampling date is April 2, 2025.

March 5, 2025

Nutrient samples were collected from six river stations on March 5th. In the five days prior to sampling, there was no precipitation recorded at T.F. Green. 

The highest total nitrogen (TN), total dissolved nitrogen (TDN) and dissolved inorganic nitrogen (DIN) concentrations were observed at Pawtuxet River @ Broad St. (TN = 1,590 ppb, TDN = 1,770 ppb, DIN = 1,533 ppb). The lowest TN, TDN, and DIN concentrations were observed on the Moshassuck River @ Footbridge at Mill St. (TN =558 ppb, TDN = 592 ppb, DIN = 441 ppb).

The next scheduled sampling date is March 19, 2025.

Scroll to Top