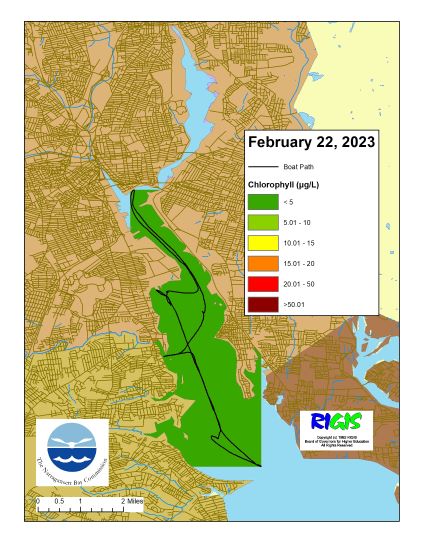
Jamie Samons

January 22-28, 2023

Nutrient samples were collected from 15 local river stations on January 25th. Bay sampling was cancelled due to a small craft advisory. In the five days prior to sampling, 1.48 inches of precipitation were recorded at T.F. Green. 

Among the river stations sampled, the highest total nitrogen (TN), total dissolved nitrogen (TDN), and dissolved inorganic nitrogen (DIN) concentrations were observed at Ten Mile River @ Central Ave. (TN = 1,930 ppb, TDN = 1,980 ppb, DIN = 1,640 ppb). The lowest TN was observed at Palmer River @ Rt. 6 (TN = 624 ppb). The lowest TDN was measured in one of the duplicate samples from Coles River @ Milford Rd. (649 ppb), while the other duplicate was slightly higher at 657 ppb; TDN was similarly low at Palmer River @ Rt. 6 (652 ppb). The lowest DIN was observed at Coles River @ Milford Rd. (DIN = 221 ppb, average of duplicates).

Data from additional sampling dates (typically every two weeks) are pending analysis and writeup.

January 15-21, 2023

Water clarity was measured at six locations in the Providence River and Seekonk River estuaries on January 18. Rainfall totaling 0.52 inches was recorded at TF Green in the five days prior to the survey. Secchi depth averaged 2.7 meters, compared to 3.3 meters on the previous survey (January 10). The lowest clarity this week (2.6 meters) was measured at India Point Park, Phillipsdale Landing, and Pomham Rocks, while the greatest clarity (2.9 meters) was measured at Bullock Reach and Conimicut Point. There was a general north-to-south gradient of increasing water clarity among the sites this week. ​

January 15-21, 2023

​On Wednesday, January 18th,​ the crew of the R/V Monitor was out on the upper Bay collecting bacteria samples, taking Secchi Disk water clarity measurements, and conducting real-time surface mapping of water quality parameters, including dissolved oxygen, chlorophyll, water temperature, salinity, and pH, all in an effort to document water quality improvements associated with NBC construction projects. Jeff captained the boat while monitoring professionals Amanda and Daryll collected the samples and data. It was mostly cloudy but relatively warm with calm waters. The featured photo taken was of the Pomham Rocks Lighthouse.​

January 15-21, 2023

Phillipsdale Landing

Overall, water quality at Phillipsdale Landing was good this week. Weather conditions started dry, with Blackstone River flows declining compared to the week prior. Substantial rain on January 19th (1.05 inches as recorded at T.F. Green), led to increased Blackstone River flows, resulting in decreased salinity at Phillipsdale at the end of the week. Over the whole week, surface salinity averaged 5.4 ppt and ranged from 1.5 ppt to 10.2 ppt. At the bottom, salinity averaged 18.7 ppt and ranged from 2.0 ppt to 30.0 ppt. Temperatures were similar this week to last, averaging 4.6°C at the surface and ranging 3.1°C – 6.8°C. At the bottom, temperatures averaged 5.6°C and ranged 4.1°C – 6.6°C.

Dissolved oxygen (DO) at Phillipsdale Landing remained above the hypoxia threshold of 2.9 mg/L throughout the week. Surface DO averaged 12.4 mg/L and ranged 11.3 – 13.9 mg/L. Bottom DO concentrations averaged 10.4 mg/L and ranged from 8.7 mg/L to 13.8 mg/L. Chlorophyll readings remained low, averaging 0.7 ug/L at the surface and 4.0 ug/L at the bottom. Maximum chlorophyll at the surface reached just 1.3 ug/L this week. Please note that tidal fluctuations and Blackstone River flows greatly influence water column salinity, temperature, and DO at this location. 

Bullock Reach 

Bullock Reach sondes will be deployed later this spring for the 2023 monitoring season. 

January 8-14, 2023

​On Tuesday, January 10th, the crew of the R/V Monitor was out on the upper Bay for the first time this year collecting nutrients and plankton samples, taking Secchi Disk water clarity measurements, and conducting real-time surface mapping of water quality parameters, including dissolved oxygen, chlorophyll, water temperature, salinity, and pH, all in an effort to document water quality improvements associated with NBC construction projects. Jeffrey captained the boat while monitoring professionals Jeff, and Tyler collected the samples and data. It was a cloudy and cool day with a calm wind out of the northwest. The water was calm all day. The featured photo shows the Conimicut Point lighthouse.

January 8-14, 2023

​Water clarity was measured at six locations in the Providence River estuary on January 10. Rainfall totaling 0.18 inches was recorded at TF Green in the five days prior to the survey. Secchi depth averaged 3.3 meters, compared to 4.2 meters on the previous survey (November 29, 2022). The lowest clarity this week (2.6 meters) was measured at India Point Park, while the greatest clarity (4.2 meters) was measured at Conimicut Point. There was a general north-to-south gradient of increasing water clarity among the sites this week. ​

January 8-14, 2023

Phillipsdale Landing

Sondes were swapped for routine maintenance on the morning of January 10th. The batteries in the bottom sonde retrieved this week died the day prior to retrieval, resulting in a data gap of approximately 16 hours from January 9th 18:00 to January 10th 9:30. Overall, water quality at Phillipsdale Landing was good this week. Weather conditions started dry, with Blackstone River flows declining compared to the week prior. Substantial rain on January 12th (0.69 inches) and 13th (0.65 inches), as recorded at T.F. Green, led to increased Blackstone River flows, resulting in decreased salinity at Phillipsdale at the end of the week. Over the whole week, surface salinity averaged 4.4 ppt and ranged from 1.4 ppt to 9.2 ppt. At the bottom, salinity averaged 17.3 ppt and ranged from 1.2 ppt to 30.0 ppt. Temperatures were similar this week to last, averaging 4.7°C at the surface and ranging 3.3°C – 6.4°C. At the bottom, temperatures averaged 5.7°C and ranged 3.9°C – 6.7°C.

Dissolved oxygen (DO) at Phillipsdale Landing remained above the hypoxia threshold of 2.9 mg/L throughout the week. Surface DO averaged 12.3 mg/L and ranged 11.6 – 13.0 mg/L. Bottom DO concentrations averaged 10.3 mg/L and ranged from 8.5 mg/L to 13.0 mg/L. Chlorophyll readings remained low, averaging 1.1 ug/L at the surface and 3.2 ug/L at the bottom. Maximum chlorophyll at the surface reached just 2.7 ug/L this week. Please note that tidal fluctuations and Blackstone River flows greatly influence water column salinity, temperature, and DO at this location. 

Bullock Reach 

Bullock Reach sondes will be deployed later this spring for the 2023 monitoring season. ​

January 8-14, 2023

Nutrient samples were collected from seven bay stations on January 10th; seven local river stations and one bay station were sampled on January 11th. Sampling was split over two days due to boating safety concerns on the routine scheduled day due to weather. All of the bay stations were sampled at the surface and bottom. In the five days prior to sampling, 0.18 inches of precipitation were recorded at T.F. Green.

Among the river stations sampled, the highest total nitrogen (TN), total dissolved nitrogen (TDN), and dissolved inorganic nitrogen (DIN) concentrations were observed at Ten Mile River @ Roger Williams Ave. (TN = 1,910 ppb, TDN = 1,930 ppb, DIN = 1,550 ppb, average of duplicates). The lowest TN, TDN, and DIN were observed at Moshassuck River @ Higginson Ave. (TN = 704 ppb, TDN = 756 ppb, DIN = 547 ppb).

Among the bay stations sampled, the highest surface nitrogen concentrations were observed at Pawtuxet Cove (TN = 1,320 ppb, TDN = 1,230 ppb, DIN = 1,030 ppb); the lowest surface nitrogen concentrations were observed at Bullock Reach (TN = 523 ppb, TDN = 439 ppb, DIN = 285 ppb). Chlorophyll a concentrations at the surface bay stations were relatively low, averaging 0.920 μg/L across all sites with a maximum of 1.663 μg/L at Bullock Reach Buoy. 

Data from additional sampling dates (typically every two weeks) are pending analysis and writeup.

January 8-14, 2023

​Surface chlorophyll data were collected on January 10, 2023 while the R/V Monitor was underway collecting nutrient samples in the Providence River estuary. The average chlorophyll concentrations were categorized as good in the areas surveyed. Overall, chlorophyll ranged between 0.28 and 2.47 µg/L with an average of 0.83 µg/L. The chlorophyll data from this date are presented in the map below using Inverse Distance Weighting (IDW) interpolation.

January 1-7, 2003

Phillipsdale Landing

Overall, water quality at Phillipsdale Landing was good this week. ​Weather conditions were moderately wet, with 0.93 inches of precipitation recorded at T.F. Green over the course of the week. The largest rain events occurred on January 3rd (0.35 inches) and 4th (0.32 inches). Blackstone River flow increased all week, remaining above historical 18-year median flow rates. Salinity at the surface at Phillipsdale was low all week, while bottom salinity varied with the tide. Surface salinity averaged 3.6 ppt and ranged from 1.9 ppt to 5.6 ppt. At the bottom, salinity averaged 16.9 ppt and ranged from 3.0 ppt to 29.5 ppt. Temperatures increased slightly over the week, averaging 5.3°C at the surface and ranging 3.6°C – 6.5°C. At the bottom, temperatures averaged 5.3°C and ranged 4.5°C – 6.1°C.

Dissolved oxygen (DO) at Phillipsdale Landing remained above the hypoxia threshold of 2.9 mg/L throughout the week. Surface DO averaged 11.9 mg/L and ranged 11.4 – 12.5 mg/L. Bottom DO concentrations averaged 10.6 mg/L and ranged from 8.7 mg/L to 12.8 mg/L. Chlorophyll readings remained low, averaging 2.0 ug/L at the surface and 2.2 ug/L at the bottom. Maximum chlorophyll at the surface reached just 3.2 ug/L this week. Please note that tidal fluctuations and Blackstone River flows greatly influence water column salinity, temperature, and DO at this location. 

Bullock Reach 

Bullock Reach sondes will be deployed later this spring for the 2023 monitoring season. 

Scroll to Top