Jamie Samons

October 29-November 4, 2023

The R/V Monitor has been retired since the last blog update for the week of February 19-25, 2023.  However, the Narragansett Bay Commission is excited to announce its new monitoring vessel, Data Stream.  The Data Stream is a brand new 2023 Parker 23290 SL: Sport cabin boat.  The Data Stream is equipped with state-of-the-art electronics, including the latest Garmin GPS with Radar overlay capability, a remote-control spotlight, and salt and freshwater wash down. Data Stream’s Yamaha engine is a 300hp electronic shift engine which is an upgrade from the 250 HP Mercury on the Monitor.

The Data Stream picked up where the Monitor left off monitoring water quality in the upper Narragansett Bay.  Throughout the Spring and Summer, the crew of the Data Stream was out on the upper Bay collecting bacteria, nutrients and plankton samples, taking Secchi Disk water clarity measurements, conducting water column profiles using the Seabird instrument, and conducting real-time surface mapping of water quality parameters, including dissolved oxygen, chlorophyll, water temperature, salinity, and pH.  In addition, the fixed site monitoring stations were deployed and continuously maintained. The featured photo shows the new monitoring vessel, Data Stream.

October 2023

​Phillipsdale Landing

The Phillipsdale Landing sondes have been deployed for the season since May 9th, 2023 utilizing a new setup allowing staff access to the equipment from the boat instead of standing on the dock. During the month of October, sondes were changed out for routine maintenance on October 10th and 24th

Surface DO remained above the hypoxia threshold all month. The bottom waters were hypoxic periodically throughout the month, with the longest sustained hypoxic periods (8 hours) occurring in the early morning of October 14th. DO averaged 8.4 mg/L at the surface with a minimum of 4.9 mg/L, while bottom waters averaged 5.5 mg/L with a minimum of 2.3 mg/L. 

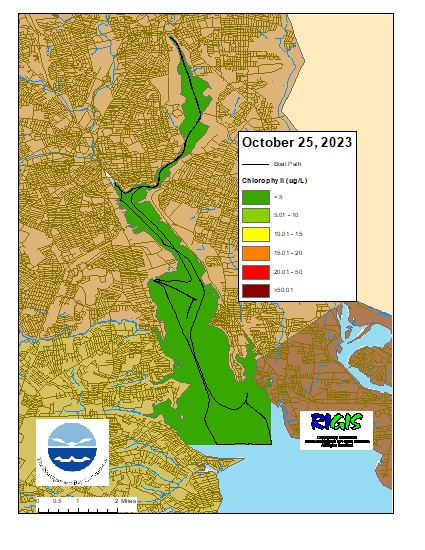
Chlorophyll readings were relatively low all month with a couple of moderately elevated readings in the bottom waters. The surface and bottom readings averaged 1.1 µg/L and 1.5 µg/L, respectively. 

Bullock Reach

The Bullock Reach buoy was deployed June 1st for the 2023 season. During the month of October, sondes were changed out for routine maintenance on October 3rd, 17th, and 31st

DO remained above the hypoxia threshold all month at the surface, middle, and bottom and averaged 7.7 mg/L, 6.7 mg/L, and 5.8 mg/L, respectively.

Chlorophyll readings ranged from low to elevated, with evidence of moderate phytoplankton blooms occurring throughout the month and some highly elevated (>200 ug/L) chlorophyll levels at the middle sonde throughout the day on October 16th. Readings averaged 6.5 µg/L at the surface, 18.3 µg/L at mid-depth, and 3.1 µg/L at the bottom. 

Please note that data from the Bullock Reach Surface sonde were not available between 11:15am on October 21st and 9:15 am on October 24th due to an equipment issue.

October 22-28, 2023

​Surface chlorophyll data were collected on October 25, 2023 while the R/V Monitor was underway collecting nutrient samples in the Providence and Seekonk River estuaries.  The average chlorophyll concentrations were categorized Good in the areas surveyed. Overall, chlorophyll ranged from 0.91 µg/L to 4.06 µg/L with an average of 1.73 µg/L. The chlorophyll concentrations from this date are presented in the map below using Inverse Distance Weighting (IDW) interpolation. 

October 15-21, 2023

Surface chlorophyll data were collected on October 18, 2023 while the R/V Monitor was underway collecting nutrient samples in the Providence and Seekonk River estuaries.  The average chlorophyll concentrations were categorized Good in the areas surveyed. Overall, chlorophyll ranged from 0.99 µg/L to 34.57 µg/L with an average of 5.52µg/L. The chlorophyll concentrations from this date are presented in the map below using Inverse Distance Weighting (IDW) interpolation.

October 15-21, 2023

Phytoplankton samples were collected on October 18, 2023 at Bullock’s Reach and analyzed in the laboratory shortly after collection. It was a cloudy and chilly day on Narragansett Bay. The water was noticeably clear to almost 5 meters depth. Sonde data revealed the surface water temperature was 15.8°C, salinity was 24.9 psu, and chlorophyll a was 7.85 ug/L. The qualitative tow net sample had a medium filter time, and the filtrate was a light brown color. Some comb jellyfish were detected in the sample.

The analysis of the quantitative whole water sample revealed a total of 1,997,000 cells per Liter. The micro flagellates were found at 419,000 cells/L. The most predominant phytoplankton genus was Skeletonema spp. at 1,255,000 cells/L. Other representative genera include Chaetoceros spp., Leptocylindrus spp., and Cerataulina spp.​​ ​This week’s featured image is the diatom Ditylum brightwellia, captured at 200x phase contrast.


October 8-14, 2023

On October 11, 2023, twenty stations were sampled for fecal coliform bacteria in the Providence and Seekonk Rivers; five of these stations were also sampled for enterococci​​ bacteria. In the five days prior to sampling, precipitation totaled 0.36 inches as recorded at TF Green. 

Overall, bacteria levels were lower in both the Seekonk and Providence Rivers this week than during the previous sampling event on September 27th. Fecal coliform levels were higher in the Seekonk River sites than in the Providence River sites (geometric means of 55 MPN/100 mL and 29 MPN/100 mL, respectively). The maximum concentration (430 MPN/100 mL) was measured at Point St Bridge. 

Enterococci results had an overall geometric mean of 17 MPN/100 mL and ranged from <10 MPN/100 mL at Gaspee Point, Conimicut Point, and Pawtuxet Cove to 187 MPN/100 mL at Point St. Bridge.

The table below lists the Rhode Island bacteria standards for primary contact and shellfishing established by the Rhode Island Department of Environmental Management (RIDEM). RIDEM defines primary contact as any recreational activities in which there is prolonged and intimate contact with water, involving considerable risk of ingesting water (e.g., swimming, diving, water skiing and surfing). Please note that the RIDEM bacteria standards are provided here for informational purposes only and are not intended to indicate official state compliance with primary contact or shellfishing standards.

Summary of Rhode Island Bacteria Standards for Saltwater Primary Contact and Shellfishing

 ​​Fecal Coli​fo​rmEnterococci
Primary Con​​​t​a​c​t1​​​​​Geom​e​tric ​me​a​n​ ≤50 MPN/1​​00​ mL
<10% ​o​f​​ samples >400 MPN/100 ​mL
Geom​etric mean ≤35 colo​nies/100 mL​
All sa​mples ≤104 colonies/100 ​​mL2
ShellfishingGeometric mean ≤14 MPN/100​ mL
<10% of samples >49 MPN/100 mL3​
NO ENTEROCOCCI CR​ITERIA

1Fecal coliform primary contact criteria app​lied only when adequate enterococci data are not available; 2Single sample maximum criterion for determining beach swimming advisories at designated beaches as evaluated by the Rhode Island Department of Health; 3For a three-tube decimal dilution

Table adapted from Rhode Island Water Quality Regulations (250-RICR-150-05-1)​; see regulations for complete details.​​​​​​​​​​

October 8-14, 2023

Surface chlorophyll data were collected on October 11th, 2023 while the R/V Monitor was underway collecting nutrient samples in the Providence and Seekonk River estuaries. The average chlorophyll concentrations were categorized as good in all areas except Edgewood Shoals which was fair. Overall, chlorophyll ranged from 129.37 µg/L to 1.02 µg/L with an average of 10.12 µg/L. The chlorophyll concentrations from this date are presented in the map below using Inverse Distance Weighting (IDW) interpolation.

October 1-7, 2023

A phytoplankton sample was collected on October 4, 2023 at Bullock’s Reach and analyzed in the laboratory shortly after collection. The plankton tow-net sample was not collected this week, only the whole-water quantitative sample. Sonde data revealed the surface water temperature was 18.50°C, salinity was 18.15 psu, and chlorophyll a was 4.23 ug/L. 

The whole water sample was analyzed and revealed a total of 676,000 cells per Liter. The micro flagellates were found at 554,000 cells/L. The most predominant phytoplankton genus was Chaetoceros spp.at 78,000 cells/L. Other representative genera include Eucampia spp. (see 400x phase contrast image below), Skeletonema spp., and Gonyaulax spp.

September 25-October 1, 2023

On September 27th, twenty stations were sampled for fecal coliform bacteria in the Providence and Seekonk Rivers; five of these stations were also sampled for enterococci bacteria. In the five days prior to sampling, precipitation totaled 2.77 inches as recorded at TF Green. 

Overall, bacteria levels were lower in both the Seekonk and Providence Rivers this week than during the previous sampling event on September 14th, likely because the first event had less time in between the rainfall and sampling. Fecal coliform levels were higher in the Seekonk River sites than in the Providence River sites (geometric means of 475 MPN/100 mL and 237 MPN/100 mL, respectively). The maximum concentration (930 MPN/100 mL) was measured at both Phillipsdale Landing and Point St Bridge. 

Enterococci results had an overall geometric mean of 102 MPN/100 mL and ranged from 31 MPN/100 mL Conimicut Point to 1,354 MPN/100 mL at Point St. Bridge.

The table below lists the Rhode Island bacteria standards for primary contact and shellfishing established by the Rhode Island Department of Environmental Management (RIDEM). RIDEM defines primary contact as any recreational activities in which there is prolonged and intimate contact with water, involving considerable risk of ingesting water (e.g., swimming, diving, water skiing and surfing). Please note that the RIDEM bacteria standards are provided here for informational purposes only and are not intended to indicate official state compliance with primary contact or shellfishing standards.

Summary of Rhode Island Bacteria Standards for Saltwater Primary Contact and Shellfishing

 ​​Fecal Coli​fo​rmEnterococci
Primary Con​​​t​a​c​t1​​​​​Geom​e​tric ​me​a​n​ ≤50 MPN/1​​00​ mL
<10% ​o​f​​ samples >400 MPN/100 ​mL
Geom​etric mean ≤35 colo​nies/100 mL​
All sa​mples ≤104 colonies/100 ​​mL2
ShellfishingGeometric mean ≤14 MPN/100​ mL
<10% of samples >49 MPN/100 mL3​
NO ENTEROCOCCI CR​ITERIA

1Fecal coliform primary contact criteria app​lied only when adequate enterococci data are not available; 2Single sample maximum criterion for determining beach swimming advisories at designated beaches as evaluated by the Rhode Island Department of Health; 3For a three-tube decimal dilution

Table adapted from Rhode Island Water Quality Regulations (250-RICR-150-05-1)​; see regulations for complete details.​​​​​​​​​​

September 24-20, 2023

Surface chlorophyll data were collected on September 27, 2023 while the R/V Monitor was underway collecting nutrient samples in the Providence and Seekonk River estuaries.  The average chlorophyll concentrations were categorized Good in the areas surveyed. Overall, chlorophyll ranged from 1.15 µg/L to 4.50 µg/L with an average of 1.96 µg/L. The chlorophyll concentrations from this date are presented in the map below using Inverse Distance Weighting (IDW) interpolation. 

Scroll to Top