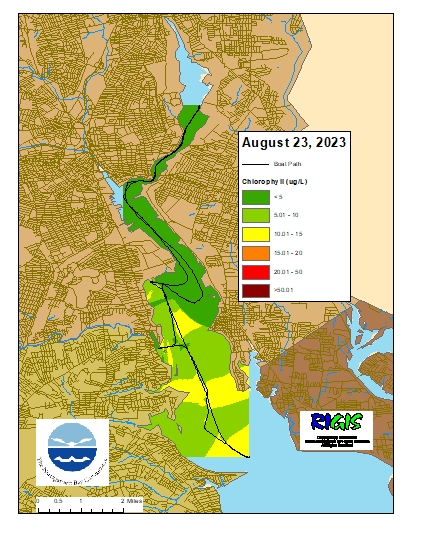
Surface chlorophyll data were collected on August 22, 2023 while the R/V Monitor was underway collecting nutrient samples in the Providence and Seekonk River estuaries. The average chlorophyll concentrations were categorized as good in the Seekonk River, Northern Providence River Channel, and Edgewood Shoals and as fair in all other areas. Overall, chlorophyll ranged from 1.56 to 44.70 µg/L with an average of 5.72 µg/L. The chlorophyll concentrations from this date are presented in the map below using Inverse Distance Weighting (IDW) interpolation.
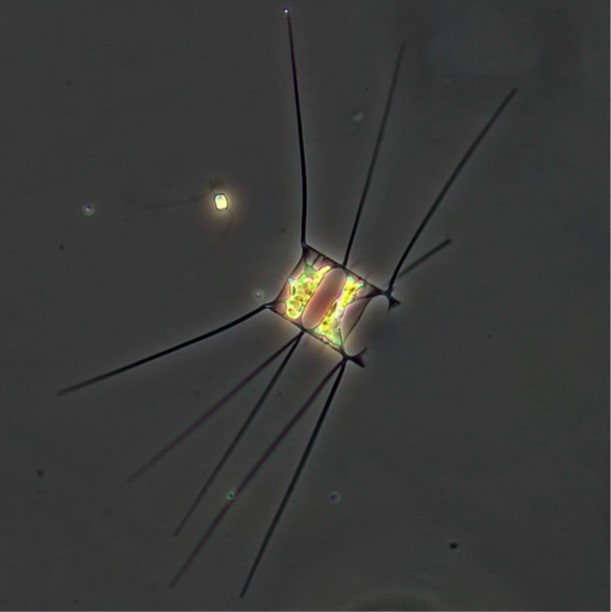
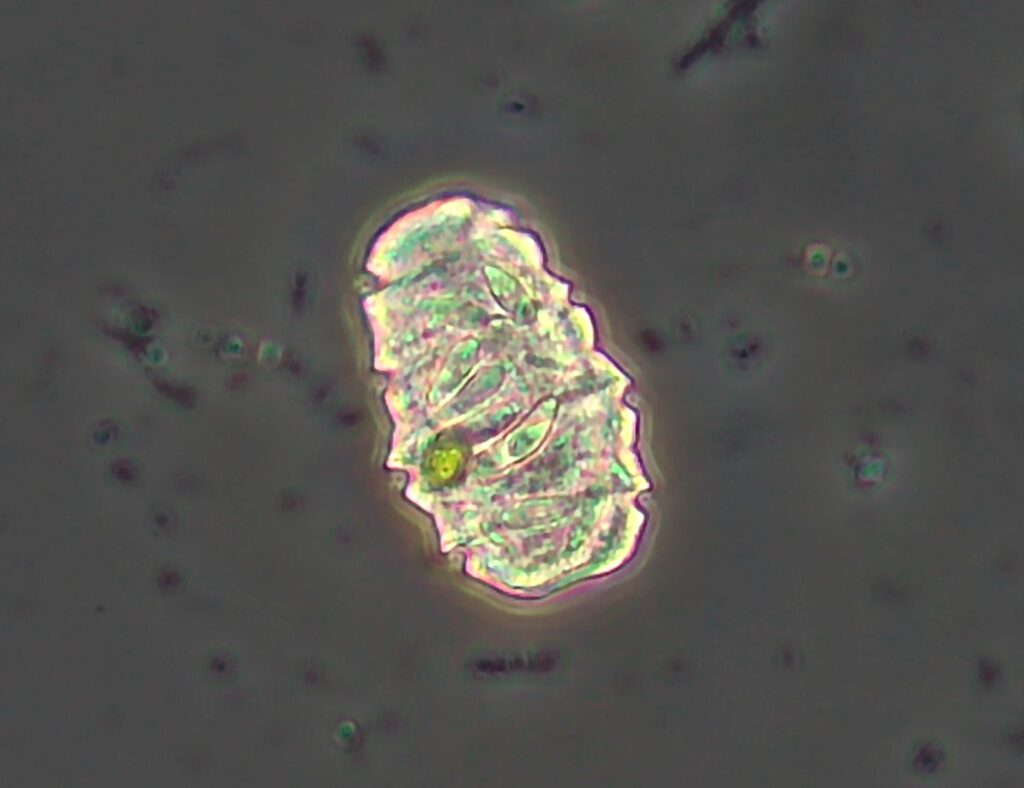
Phytoplankton samples were collected on August 23, 2023 at Bullock Reach and analyzed in the laboratory shortly after collection. Sonde data revealed the surface water temperature was 21.0°C and salinity was 26.5 psu. The plankton tow net sample was filterable with a 20 micron mesh. The filtrate was a light brown color and had a quick filter time. The tow net sample was analyzed qualitatively for microorganisms using phase contrast microscopy. The whole water sample was analyzed quantitatively under 200x phase contrast microscopy. A Hensen Stempel pipette was used to accurately deliver 1ml of sample to a Sedge-wick Rafter chamber. This analysis revealed a total of 1,866,000 cells per Liter. The micro flagellates were found at 348,000 cells/L. The most predominant phytoplankton genus was Leptocylindrus spp.at 948,000 cells/L. Other representative genera include Skeletonema spp., Chaetoceros spp. (see 200x phase contrast image below), and Guinardia spp.
Water clarity was measured at five locations in the Providence River and Seekonk River estuaries on August 16. Rainfall totaling 0.61 inches was recorded at TF Green in the five days prior to the survey. Secchi depth averaged 2.8 meters, compared to 1.8 meters on the previous survey (August 9). The lowest clarity this week (1.9 meters) was measured at Phillipsdale Landing, while the greatest clarity (3.6 meters) was measured at Point St. Bridge. There was no clear north-to-south gradient in water clarity among the sites this week.
On August 16, twenty stations were sampled for fecal coliform bacteria in the Providence and Seekonk Rivers. Five of these stations were also sampled for enterococci bacteria. Precipitation in the five days prior to sampling totaled 0.61 inches as recorded at TF Green.
The geometric mean of fecal coliform results for all sites was 149 MPN/100 mL compared to 41 MPN/100 mL on August 2. Overall, bacteria counts were higher in both the Seekonk and Providence Rivers this week than during the previous sampling event on August 2. Fecal coliform counts were geomeans of 435 MPN/ 100 mL in the Seekonk River and 90 MPN/ 100 mL in the Providence River. The maximum count (9300 MPN/100 mL) was measured at Bullock Reach Buoy in the Providence River.
Enterococci results had an overall geometric mean of 35 MPN/100 mL. Enterococci counts ranged from non-detect at a Gaspee Point and Conimicut Point to 238 MPN/100 mL at Point St. Bridge.
The table below lists the Rhode Island bacteria standards for primary contact and shellfishing established by the Rhode Island Department of Environmental Management (RIDEM). RIDEM defines primary contact as any recreational activities in which there is prolonged and intimate contact with water, involving considerable risk of ingesting water (e.g., swimming, diving, water skiing and surfing). Please note that the RIDEM bacteria standards are provided here for informational purposes only and are not intended to indicate official state compliance with primary contact or shellfishing standards.
Summary of Rhode Island Bacteria Standards for Saltwater Primary Contact and Shellfishing
Geometric mean ≤35 colonies/100 mL All samples ≤104 colonies/100 mL2
Shellfishing
Geometric mean ≤14 MPN/100 mL <10% of samples >49 MPN/100 mL3
NO ENTEROCOCCI CRITERIA
1Fecal coliform primary contact criteria applied only when adequate enterococci data are not available; 2Single sample maximum criterion for determining beach swimming advisories at designated beaches as evaluated by the Rhode Island Department of Health; 3For a three-tube decimal dilution
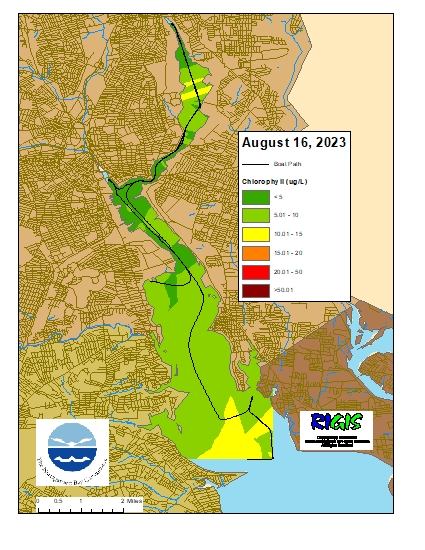
Surface chlorophyll data were collected on August 16, 2023 while the R/V Monitor was underway collecting nutrient samples in the Providence and Seekonk River estuaries. The average chlorophyll concentrations were categorized as good in the Seekonk River and Northern Providence River Channel and as fair in all others. Overall, chlorophyll ranged from 1.46 to 17.84 µg/L with an average of 5.21 µg/L. The chlorophyll concentrations from this date are presented in the map below using Inverse Distance Weighting (IDW) interpolation.
*Due to file error the lowest portion of the boat path for this survey is not displayed.
Water clarity was measured at seven locations in the Providence River and Seekonk River estuaries on August 9. Rainfall totaling 0.48 inches was recorded at TF Green in the five days prior to the survey. Secchi depth averaged 1.8 meters, compared to 2.3 meters on the previous survey (August 2). The lowest clarity this week (1.2 meters) was measured at Phillipsdale Landing, while the greatest clarity (2.1 meters) was measured at Pomham Rocks. There was no clear north-to-south gradient in water clarity among the sites this week.
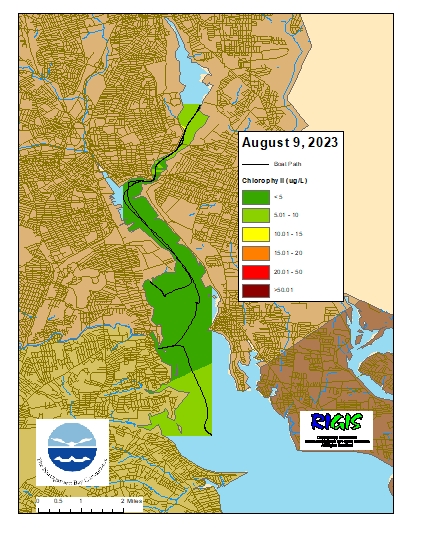
Surface chlorophyll data were collected on August 9, 2023 while the R/V Monitor was underway collecting nutrient samples in the Providence and Seekonk River estuaries. The average chlorophyll concentrations were categorized as good in the Northern Providence River Channel, Edgewood Shoals, and Pawtuxet River Area and as fair in all other areas. Overall, chlorophyll ranged from 1.21 to 16.01 µg/L with an average of 5.34 µg/L. The chlorophyll concentrations from this date are presented in the map below using Inverse Distance Weighting (IDW) interpolation.
*Due to file error the lowest portion of the boat path for this survey is not displayed.
Phytoplankton samples were collected on August 9, 2023 at Bullock’s Reach and analyzed in the laboratory shortly after collection. Sonde data revealed the surface water temperature was 23.4°C, salinity was 24.1 psu, and chlorophyll a was 7.2 ug/L. The plankton tow net sample was filterable with a 20 micron mesh. The filtrate was a light brown greenish color and had a long filter time. Lots of activity was present in the sample and comb jellies were detected. The tow net sample was analyzed qualitatively for microorganisms using phase contrast microscopy. The whole water sample was analyzed quantitatively under 200x phase contrast microscopy. A Hensen Stempel pipette was used to accurately deliver 1ml of sample to a Sedge-wick Rafter chamber. This analysis revealed a total of 89,000 cells per Liter. The micro flagellates were found at 70,000 cells/L. The most predominant phytoplankton genus was Dinophysis spp.at 4,000 cells/L. Other representative genera include Scripsiella spp., Guinardia spp., Eutreptiella spp., and Polykrikos spp., the featured plankton taxon in the 200x phase contrast micrograph below.
Water clarity was measured at six locations in the Providence River and Seekonk River estuaries on August 2. Rainfall totaling 0.66 inches was recorded at TF Green in the five days prior to the survey, all of which occurred on July 29. Secchi depth averaged 2.3 meters, compared to 1.1 meters on the previous survey (July 27). The lowest clarity this week (1.4 meters) was measured at Phillipsdale Landing, while the greatest clarity (3.1 meters) was measured at India Point Park. There was no clear north-to-south gradient in water clarity among the sites this week.
On August 2, twenty stations were sampled for fecal coliform bacteria in the Providence and Seekonk Rivers. Five of these stations were also sampled for enterococci bacteria. Precipitation in the five days prior to sampling totaled 0.66 inches as recorded at TF Green.
The geometric mean of fecal coliform results for all sites was 41 MPN/100 mL compared to 463 MPN/100 mL on July 19. Overall, bacteria counts were lower in both the Seekonk and Providence Rivers this week than during the previous sampling event on July 19. Fecal coliform counts were geomeans of 97 MPN/ 100 mL in the Seekonk River and 28 MPN/ 100 mL in the Providence River. The maximum count (930 MPN/100 mL) was measured at Point St. Bridge in the Providence River.
Enterococci results had an overall geometric mean of 13 MPN/100 mL. Enterococci counts ranged from non-detect at Gaspee Point, Conimicut Point, and a Phillipsdale Landing duplicate to 52 MPN/100 mL at Point St. Bridge.
The table below lists the Rhode Island bacteria standards for primary contact and shellfishing established by the Rhode Island Department of Environmental Management (RIDEM). RIDEM defines primary contact as any recreational activities in which there is prolonged and intimate contact with water, involving considerable risk of ingesting water (e.g., swimming, diving, water skiing and surfing). Please note that the RIDEM bacteria standards are provided here for informational purposes only and are not intended to indicate official state compliance with primary contact or shellfishing standards.
Summary of Rhode Island Bacteria Standards for Saltwater Primary Contact and Shellfishing
Geometric mean ≤35 colonies/100 mL All samples ≤104 colonies/100 mL2
Shellfishing
Geometric mean ≤14 MPN/100 mL <10% of samples >49 MPN/100 mL3
NO ENTEROCOCCI CRITERIA
1Fecal coliform primary contact criteria applied only when adequate enterococci data are not available; 2Single sample maximum criterion for determining beach swimming advisories at designated beaches as evaluated by the Rhode Island Department of Health; 3For a three-tube decimal dilution