Jamie Samons

July 2023

Phillipsdale Landing

The Phillipsdale Landing sondes have been deployed since May 9th, 2023 utilizing a new setup allowing staff access to the equipment from the boat instead of standing on the dock. Sondes were changed out for routine maintenance on July 6th and July 18th. July was a wet month, with 8.37 inches of precipitation recorded at T.F. Green. The largest storm occurred on July 16th (3.35 inches). Blackstone River flows were elevated due to the frequent precipitation throughout the month of July. Salinity at Phillipsdale averaged 4.3 ppt at the surface (range 0.2 – 18.8 ppt) and 42.0 ppt at the bottom (range -0.6 – 108.9 ppt). Temperatures increased from June, averaging 25.4°C at the surface and 24.0°C at the bottom. Surface temperatures ranged 22.6 – 30.0°C, while bottom temperatures ranged 21.0 – 26.7°C. 

The surface dissolved oxygen (DO) concentrations remained mostly above the hypoxia threshold (2.9 mg/L), only briefly dropping below the threshold for a half hour the morning of July 10th. The bottom waters were hypoxic periodically throughout the month. The longest sustained period of hypoxic conditions (~1.5 days) occurring from the morning of July 9th until the night of July 10th. DO averaged 7.3 mg/L at the surface with a minimum of 2.2 mg/L, while bottom waters averaged 3.3 mg/L with a minimum of -0.1 mg/L. 

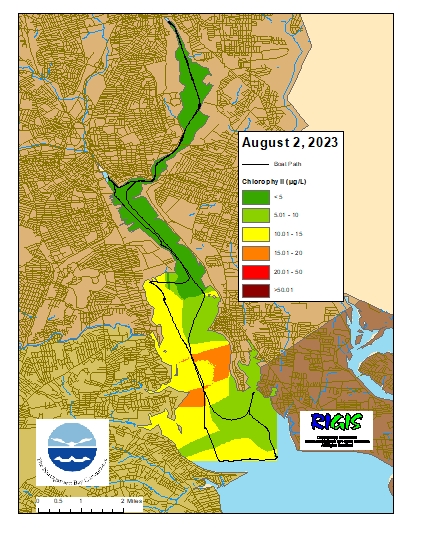
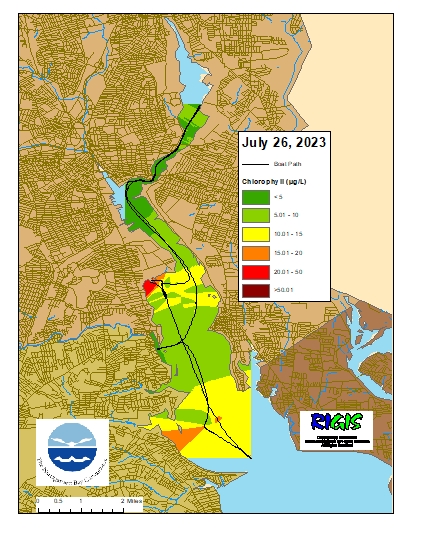
Chlorophyll readings were generally low with periods of moderately elevated chlorophyll intermittently through the month, suggestive of moderate phytoplankton blooms. The surface and bottom readings averaged 8.3µg/L and 8.6 µg/L, respectively. The maximum surface reading of 112.8 µg/L occurred on July 9th and the maximum bottom reading of 130.9 µg/L occurred on July 22nd.  Please note that data from the bottom sonde between July 23rd and the 29th was excluded due to mud compromising the results. Also, gaps occurred in the bottom on July 4th to the 6th potentially due to equipment failure. 

Bullock Reach

The Bullock Reach buoy was deployed June 1st for the 2023 season. Sondes were changed out for routine maintenance on July 11th and 25th. Overall, water quality was fair at Bullock Reach Buoy throughout the month of July 2023. Surface, middle, and bottom DO averaged 7.5 mg/L, 4.8 mg/L, and 2.6 mg/L, respectively. Hypoxic conditions were not observed at the surface. However, hypoxic conditions occurred sporadically in middle waters beginning July 19th. Bottom waters periodically fell below the hypoxia threshold (2.9 mg/L) throughout the month and the longest duration of hypoxic conditions occurred for 5.5 days between the 22nd and the 28th.  

Surface salinity at Bullock Reach ranged 9.5 – 27.2 ppt and averaged 21.1 ppt. Mid-depth salinity ranged 16.4 – 30.0 ppt and averaged 25.7 ppt. Bottom salinity ranged 23.5 – 31.3 ppt and averaged 30.1 ppt. Water column temperatures averaged 25.7°C, 25.1°C, and 22.1°C at the surface, middle, and bottom, respectively. Temperatures ranged 23.2°C – 28.6°C at the surface, 21.6°C – 27.4°C at mid-depth, and 19.4°C – 25.7°C at the bottom. 

Chlorophyll readings were moderately elevated, averaging 25.7 µg/L at the surface, 15.0 µg/L at mid-depth, and 2.8 µg/L at the bottom. Periods of elevated chlorophyll occurred around July 6th – 10th. The maximum surface reading of 81.2 µg/L occurred on July 22nd. Please note that minor data gaps occurred between the 8th to the 25th on the surface and bottom due to potential equipment failure and fouling.

Please note that the data exclusions mentioned in the above text for Phillipsdale Landing and Bullock Reach does not affect the raw data, and any exclusions occurred during a QC process, prior to the average, maximum, and minimum calculations discussed.

July 23-29, 2023

​Water clarity was measured at eight locations in the Providence River and Seekonk River estuaries on July 27. Rainfall totaling 0.47 inches was recorded at TF Green in the five days prior to the survey. Secchi depth averaged 1.1 meters, compared to 1.0 meters on the previous survey (July 12). The lowest clarity this week (1.1 meters) was measured at India Point Park, Edgewood Yacht Club, Phillipsdale Landing, Conimicut Point, and Edgewood Shoal, while the greatest clarity (1.3 meters) was measured at Pawtuxet Cove. There was no clear north-to-south gradient in water clarity among the sites this week.​

July 23-29, 2023

​Surface chlorophyll data were collected on July 26, 2023 while the R/V Monitor was underway collecting nutrient samples in the Providence and Seekonk River estuaries. The average chlorophyll concentrations were categorized as good in the Seekonk River and as fair in all other areas. Overall, chlorophyll ranged from 2.18 to 29.09 µg/L with an average of 9.37 µg/L. The chlorophyll concentrations from this date are presented in the map below using Inverse Distance Weighting (IDW) interpolation.

July 23-29, 2023

​Phytoplankton samples were collected on July 26, 2023 at Bullock Reach and analyzed in the laboratory shortly after collection. Sondes data revealed the surface water temperature was 25.586⁰C, salinity was 16.22psu, and chlorophyll a was 19.77 ug/L. It was a hot and humid day with calm conditions on Narragansett Bay. The plankton tow net sample was filterable with a 20 micron mesh. The filtrate was a light tan color and had a quick filter time. Some small comb jellies were detected. The tow net sample was analyzed qualitatively for microorganisms using phase contrast microscopy. The whole water sample was analyzed quantitatively under 200x phase contrast microscopy. A Hensen Stempel pipette was used to accurately deliver 1ml of sample to a Sedge-wick Rafter chamber. This analysis revealed a total of 462,000 cells per Liter. The micro flagellates were found at 376,000 cells/L. The most predominant phytoplankton genus was Heterocapsa spp. at 38,000 cells/L. Other representative genera include Guinardia spp., Thalassiosira spp., and Eutreptiella spp.

 200x phase contrast micrograph of Eucampia spp.

July 23-29, 2023

Nutrient samples were collected from 14 river stations and 8 bay stations on July 26th. Edgewood Shoal was sampled at the surface and bottom; all other bay stations were sampled at the surface only. In the five days prior to sampling, there were 0.47 inches of rainfall recorded at T.F. Green.

Among the river stations sampled, the highest total nitrogen (TN) and total dissolved nitrogen (TDN) concentrations were observed at Ten Mile River @ Central Ave. (TN = 1,470 ppb, TDN = 1,550 ppb); the highest dissolved inorganic nitrogen (DIN) concentration was observed at Pawtuxet River @ Broad St. (1,120 ppb).  The lowest TN and TDN were observed at Moshassuck River @ Footbridge at Mill St. (TN = 654 ppb, TDN = 688 ppb, average of duplicates), while the lowest DIN was at Coles River @ Milford Rd. (147 ppb).

Among the bay stations sampled, the highest surface TN was observed at Pomham Rocks (989 ppb), the highest surface TDN was observed at Phillipsdale Landing (940 ppb), and the highest surface DIN was observed at Pawtuxet Cove (679 ppb). The lowest surface TN was observed at India Point Park (TN = 731 ppb), while the lowest surface TDN and DIN were at Bullock Reach Buoy (TDN = 230 ppb, DIN = 24.0 ppb). Chlorophyll a concentrations at the surface bay stations were moderately elevated this week; concentrations averaged 14.5 μg/L overall with a maximum of 26.4 μg/L at Bullock Reach Buoy.

The next scheduled sampling date is August 8, 2023.

July 23-29, 2023

Water column profiles were conducted at eight locations in the Providence and Seekonk River estuaries on July 26, 2023 using a Seabird Electronics profiler. In the three days leading up to the survey, there were 0.10 inches of precipitation recorded at T.F. Green. Moderate density stratification was observed at Edgewood Shoal; all other sites still exhibited strong stratification this week.

Dissolved oxygen (DO) conditions were below the hypoxia threshold (2.9 mg/L) in the middle and/or lower half of the water column at all sites surveyed. Fluorescence was moderately elevated at the surface of most sites this week, but relatively low at Phillipsdale Landing and India Point Park.​

July 23-29, 2023

Nutrient samples were collected from 14 river stations and 8 bay stations on July 26th. Edgewood Shoal was sampled at the surface and bottom; all other bay stations were sampled at the surface only. In the five days prior to sampling, there were 0.47 inches of rainfall recorded at T.F. Green.

Among the river stations sampled, the highest total nitrogen (TN) and total dissolved nitrogen (TDN) concentrations were observed at Ten Mile River @ Central Ave. (TN = 1,470 ppb, TDN = 1,550 ppb); the highest dissolved inorganic nitrogen (DIN) concentration was observed at Pawtuxet River @ Broad St. (1,120 ppb).  The lowest TN and TDN were observed at Moshassuck River @ Footbridge at Mill St. (TN = 654 ppb, TDN = 688 ppb, average of duplicates), while the lowest DIN was at Coles River @ Milford Rd. (147 ppb).

Among the bay stations sampled, the highest surface TN was observed at Pomham Rocks (989 ppb), the highest surface TDN was observed at Phillipsdale Landing (940 ppb), and the highest surface DIN was observed at Pawtuxet Cove (679 ppb). The lowest surface TN was observed at India Point Park (TN = 731 ppb), while the lowest surface TDN and DIN were at Bullock Reach Buoy (TDN = 230 ppb, DIN = 24.0 ppb). Chlorophyll a concentrations at the surface bay stations were moderately elevated this week; concentrations averaged 14.5 μg/L overall with a maximum of 26.4 μg/L at Bullock Reach Buoy.

The next scheduled sampling date is August 8, 2023.

July 23-29, 2023

Water column profiles were conducted at eight locations in the Providence and Seekonk River estuaries on July 26, 2023 using a Seabird Electronics profiler. In the three days leading up to the survey, there were 0.10 inches of precipitation recorded at T.F. Green. Moderate density stratification was observed at Edgewood Shoal; all other sites still exhibited strong stratification this week.

Dissolved oxygen (DO) conditions were below the hypoxia threshold (2.9 mg/L) in the middle and/or lower half of the water column at all sites surveyed. Fluorescence was moderately elevated at the surface of most sites this week, but relatively low at Phillipsdale Landing and India Point Park.​

July 16-22, 2023

On July 19, twenty stations were sampled for fecal coliform bacteria in the Providence and Seekonk Rivers.  Five of these stations were also sampled for enterococci bacteria. Precipitation in the five days prior to sampling totaled 3.96 inches as recorded at TF Green, most of which occurred on July 16.

The geometric mean of fecal coliform results for all sites was 463 MPN/100 mL compared to 3472 MPN/100 mL on July 5. Overall, bacteria counts were lower in both the Seekonk and Providence Rivers this week than during the previous sampling event on July 5. Fecal coliform counts were geomeans of 289 MPN/ 100 mL in the Seekonk River and 578 MPN/ 100 mL in the Providence River. The maximum count (9300 MPN/100 mL) was measured at Point St. Bridge in the Providence River.

Enterococci results had an overall geometric mean of 26 MPN/100 mL. Enterococci counts ranged from non-detect at a Phillipsdale Landing duplicate to 158 MPN/100 mL at Point St. Bridge.

The table below lists the Rhode Island bacteria standards for primary contact and shellfishing established by the Rhode Island Department of Environmental Management (RIDEM). RIDEM defines primary contact as any recreational activities in which there is prolonged and intimate contact with water, involving considerable risk of ingesting water (e.g., swimming, diving, water skiing and surfing). Please note that the RIDEM bacteria standards are provided here for informational purposes only and are not intended to indicate official state compliance with primary contact or shellfishing standards.

Summary of Rhode Island Bacteria Standards for Saltwater Primary Contact and Shellfishing

 ​​Fecal Coli​fo​rmEnterococci
Primary Con​​​t​a​c​t1​​​​​Geom​e​tric me​a​n​ ≤50 MPN/1​​00​ mL
<10% ​o​f​ samples >400 MPN/100 ​mL
Geom​etric mean ≤35 colo​nies/100 mL​
All sa​mples ≤104 colonies/100 ​​mL2
ShellfishingGeometric mean ≤14 MPN/100​ mL
<10% of samples >49 MPN/100 mL3​
NO ENTEROCOCCI CR​ITERIA

1Fecal coliform primary contact criteria app​lied only when adequate enterococci data are not available; 2Single sample maximum criterion for determining beach swimming advisories at designated beaches as evaluated by the Rhode Island Department of Health; 3For a three-tube decimal dilution

Table adapted from Rhode Island Water Quality Regulations (250-RICR-150-05-1)​; see regulations for complete details.​​​​​​​​​​​

July 16-22, 2023

​Surface chlorophyll data were collected on July 19, 2023 while the R/V Monitor was underway collecting bacteria samples in the Providence and Seekonk River estuaries. The average chlorophyll concentrations were categorized as good in the Seekonk River and Northern Providence River Channel and as fair in the Pawtuxet River, Edgewood Shoals, and Southern Providence River areas. Overall, chlorophyll ranged from 1.26 to 24.06 µg/L with an average of 7.04 µg/L. The chlorophyll concentrations from this date are presented in the map below using Inverse Distance Weighting (IDW) interpolation.

Scroll to Top