Snapshot of the Bay

R/V Monitor on Upper Bay

R/V Monitor on the Upper Bay

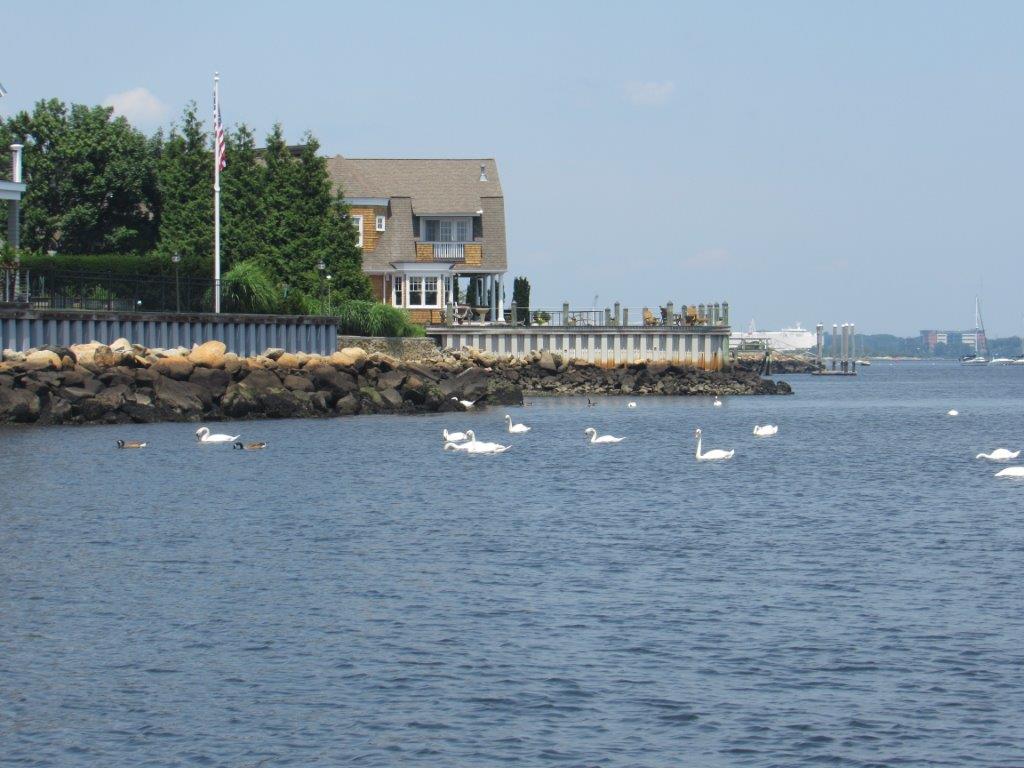
On Wednesday, July 7th, the crew of the R/V Monitor was out on the upper Bay collecting bacteria samples, taking Secchi Disk water clarity measurements, and conducting water column profiles using the Seabird instrument, all in an effort to document water quality improvements associated with NBC construction projects.  Real-time surface mapping of water quality parameters and Par sensor water clarity measurements were not collected this day due to a computer malfunction. Jeff captained the boat while monitoring professionals Gerard, Justin, and Steve collected the samples and data. It was a warm, humid and partly sunny day. There was no breeze early on, but one picked up as the day progressed. The featured photo is of some swans enjoying the fine summer weather.
Bullock Reach, Week of June 27-July 3 2021

Sondes at Bullock Reach were changed out for routine maintenance in the morning on June 29th. As noted last week, the bottom sonde deployed June 15-29, 2021 did not record data, so the summary below includes bottom data only from the partial week. Water quality at Bullock Reach was good-to-fair this week. Salinity at the surface averaged 24.2 ppt and ranged from 19.5 ppt to 27.7 ppt. Salinity at the mid depth averaged 27.4 ppt and ranged from 22.1 ppt to 30.8 ppt. Salinity in bottom waters averaged 30.3 ppt and ranged from 28.3 ppt to 31.8 ppt. Temperatures averaged 24.3°C, 23.0°C, and 20.0°C at the surface, mid, and bottom, respectively. Surface temperatures ranged from 20.0°C to 27.8°C, mid temperatures ranged from 19.7°C to 25.8°C, and bottom temperatures ranged 18.4°C to 21.9°C.

Dissolved oxygen (DO) data this week should be interpreted with caution due to a calibration issue with the sondes retrieved June 29th that resulted in the data biasing high. These data will be reviewed in detail at the end of the season and adjusted as necessary by the Narragansett Bay Fixed Site Monitoring Network. This week surface DO averaged 8.4 mg/L, while mid DO averaged 6.4 mg/L, and bottom DO averaged 4.4 mg/L. The minimum DO was recorded at the mid-depth as 2.9 mg/L on July 3rd. Chlorophyll concentrations remained slightly elevated, averaging 11.4 ug/L at the surface, 10.1 ug/L in mid-depth waters, and 4.1 ug/L at the bottom. The maximum water column chlorophyll concentration was 50.4 ug/L, measured in bottom waters on June 30th.

Phillipsdale Landing, Week of June 27-July 3 2021

Water quality at Phillipsdale was fair-to-poor this week. Moderate rainfall of 0.56 inches was recorded at TF Green on July 1st, and sporadic pop-up showers throughout the watershed also occurred. Blackstone River flows remained elevated over historical median levels. Salinity at the surface averaged 11.3 ppt and ranged from 2.2 ppt to 18.5 ppt, while bottom salinity averaged 19.1 ppt and ranged from 2.5 ppt to 28.6 ppt. Surface water temperatures warmed compared to the previous week, averaging 24.6°C and ranging from 19.9°C to 30.2°C. Bottom water temperatures also warmed, averaging 23.0°C and ranging from 19.5°C to 25.4°C.

Surface DO averaged 7.9 mg/L, with a minimum of 3.6 mg/L, while bottom DO averaged 4.0 mg/L, with a minimum of 1.0 mg/L. Intermittent hypoxic conditions (DO <2.9 mg/L) were observed in bottom waters during the latter half of the week, with a maximum duration of 8 hours, occurring overnight from July 1st to 2nd. Surface chlorophyll concentrations were elevated, averaging 39.0 ug/L with a maximum result of 125.1 ug/L on June 29th. Bottom chlorophyll averaged 30.8 ug/L with an isolated spike in the data most likely due to particulate or macroalgae interference. Please note that tidal fluctuations and Blackstone River flow greatly influence water column salinity, temperature, and dissolved oxygen at this location.

View Post

Scroll to Top