Clean Water Open House: Follow the Flush!

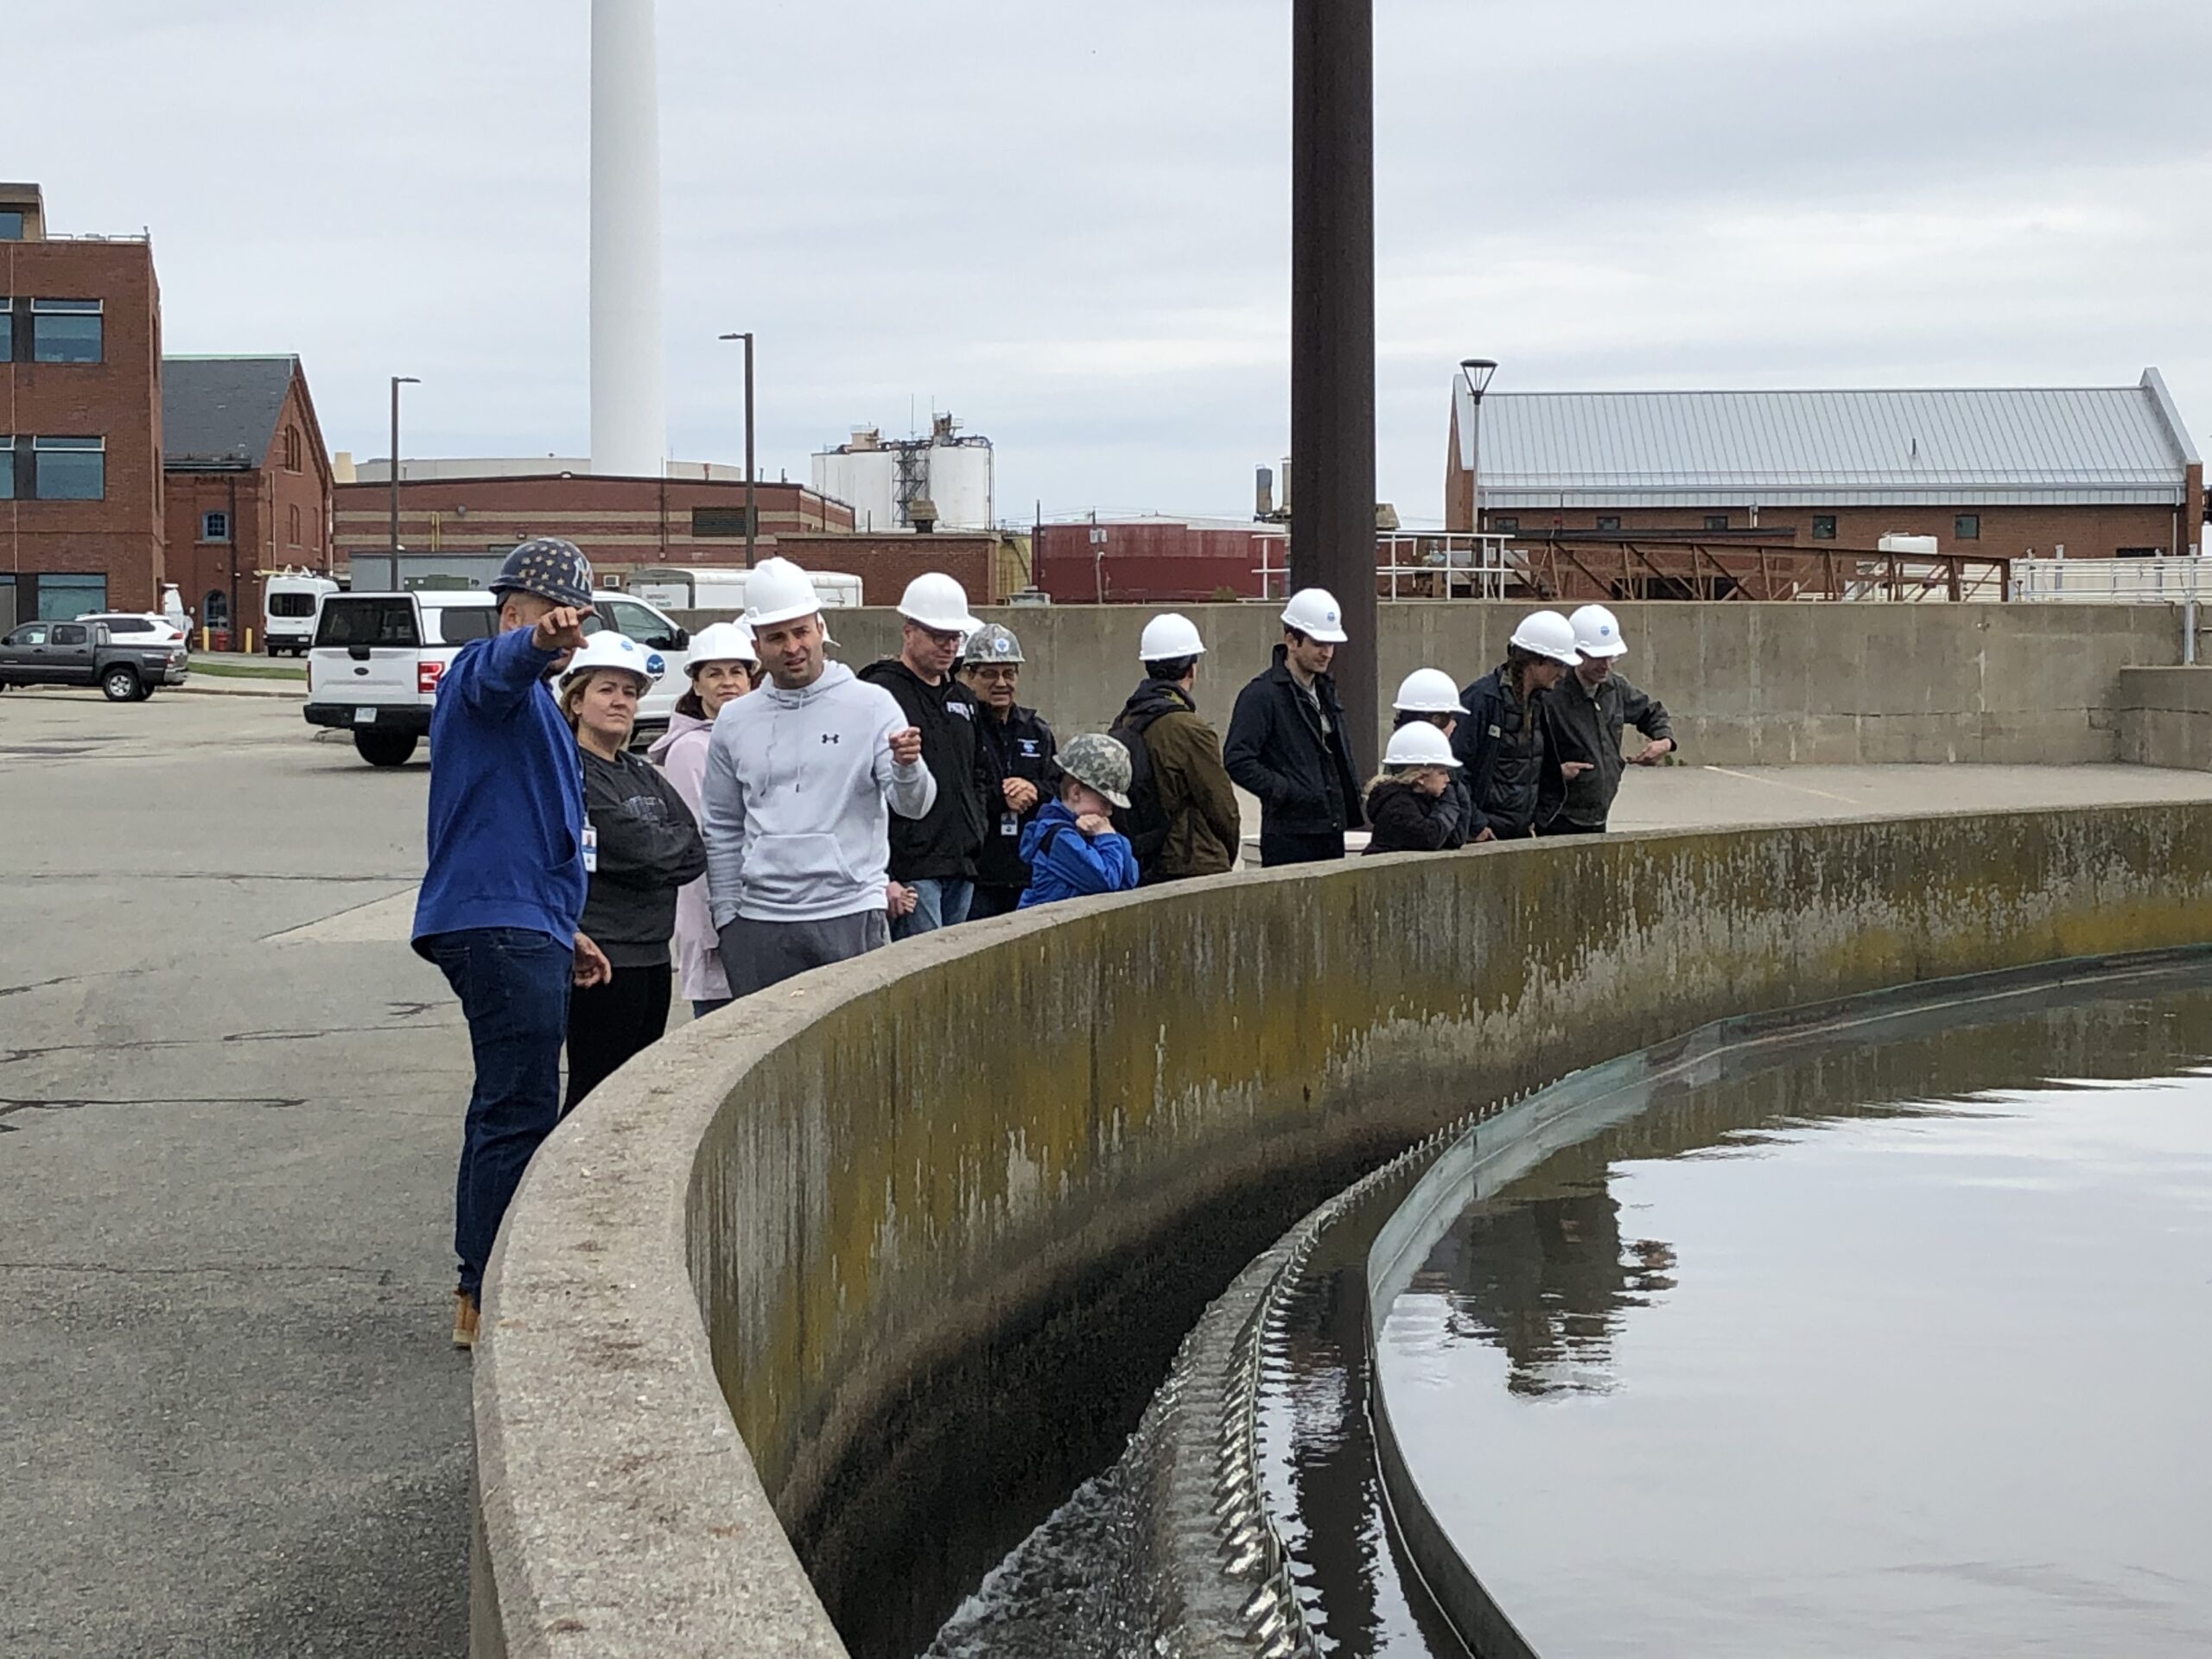
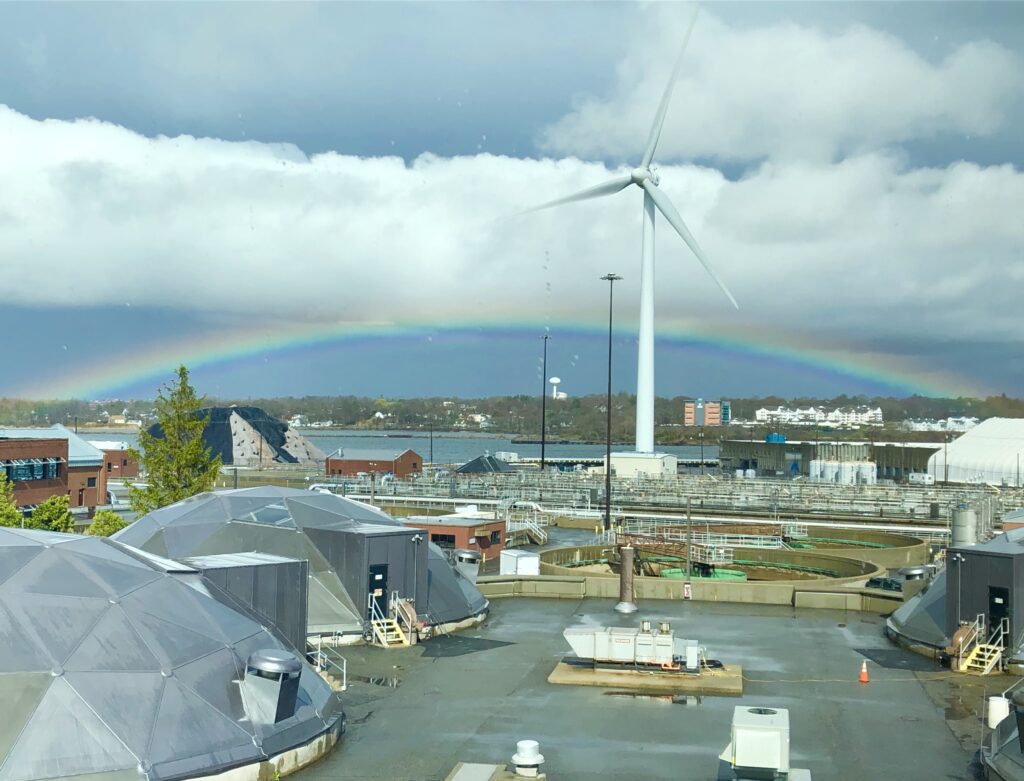
In celebration of Rhode Island Clean Water Week, the Narragansett Bay Commission (NBC) will offer free public tours of its award-winning Field’s Point Wastewater Treatment Facility in Providence on Saturday, April 18 from 10:00 AM to 1:00 PM.

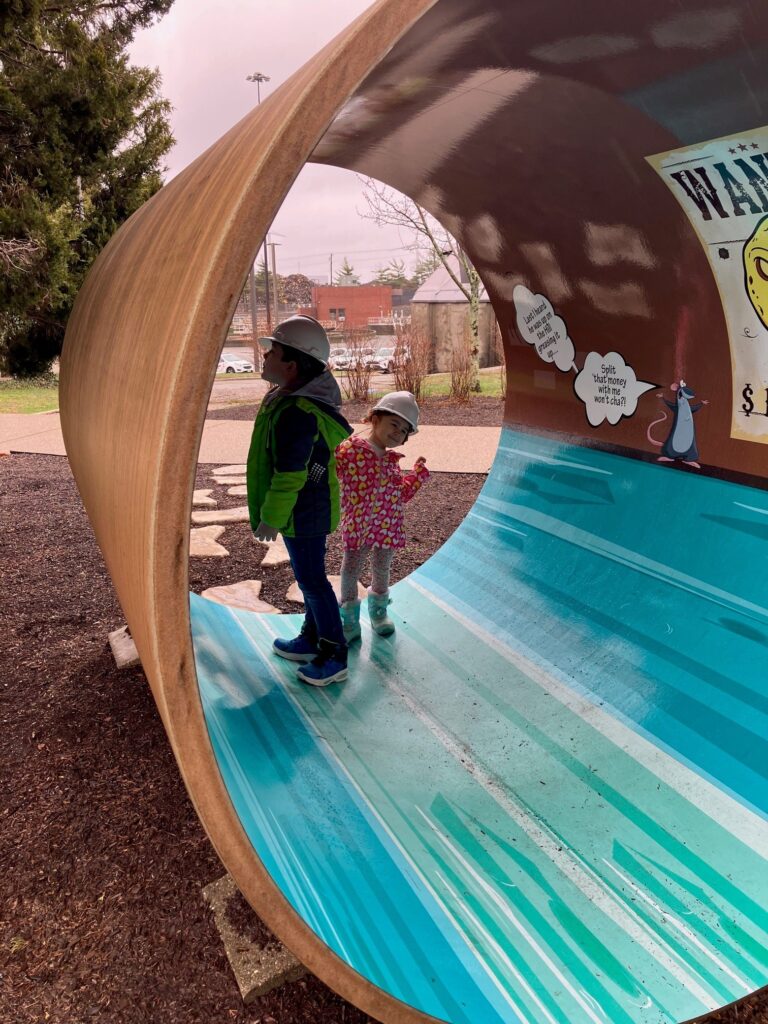
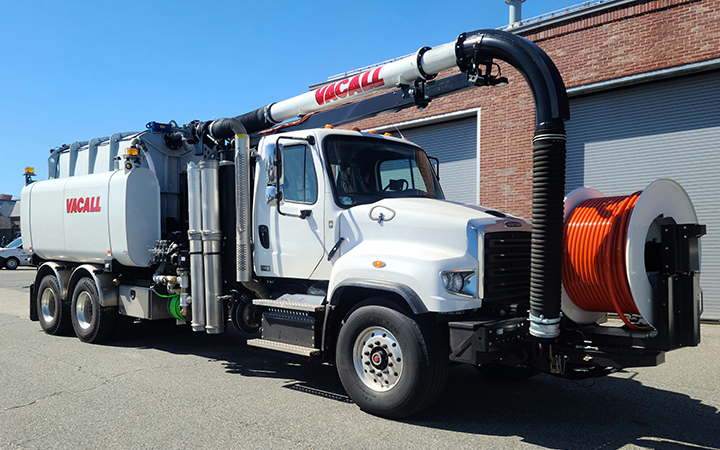
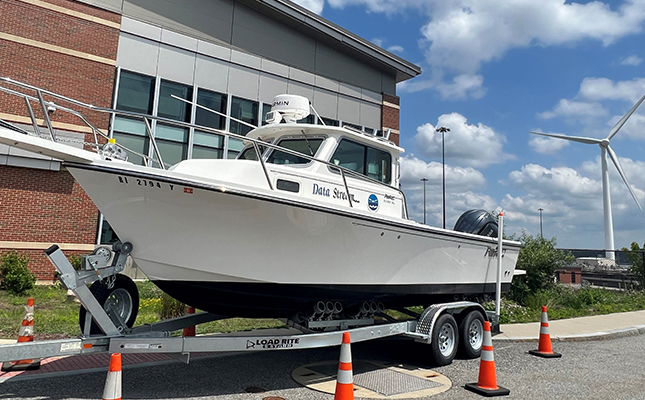
The tours will include a look at the region’s most sophisticated water quality lab, “touch-a-truck” and “touch-a-boat” with the NBC’s maintenance and research vehicles, photo ops inside a sewer pipe, and other fun activities.

In addition, the NBC will issue certificates of completion to all students who take the tour that may be redeemed for extra credit at school (but students are advised check with their teacher first).

Members of the public can book a tour at 10:00 AM, 10:30 AM, 11:00 AM, 11:30 AM or 12:00 noon by emailing nbcpr@narrabay.com. Spaces are limited. The tour will take approximately 90 minutes.

Enter NBC’s 2027 Student Poster Contest Today!

Contest deadline is Friday, May 1!

The Narragansett Bay Commission (NBC) is proud to sponsor its 33rd annual student poster contest. The theme of this year’s contest is Water’s Journey Through Time. The NBC would like students to artistically showcase how water has changed or will change over time. Students may want to research what the Narragansett Bay looked like many years ago and depict that view in their poster. Some may want to use their imaginations and create a poster of what Narragansett Bay will look like 20, 30, 40, or even 50 years from now. Others may want to create snapshots of Narragansett Bay starting in the past and traveling into the future. We encourage students to use their creativity and come up with their own idea of what the theme means to them.

The theme of the poster contest this year correlates with an event where NBC will open a time capsule that was buried 25 years ago. The time capsule was buried on April 24, 2001, in honor of NBC Field’s Point Wastewater Treatment Facility’s 100th birthday! The ceremony will take place during Clean Water Week. There are other events happening around the state honoring water that week. Please visit https://ricwa.org/event/clean-water-week-open-house/ to learn more.

The contest rules are as follows:

  • Students must be in grades K-6 and reside in Providence, North Providence, Johnston, Central Falls, Lincoln, Pawtucket, Cumberland, Cranston, Smithfield, or East Providence.
  • Posters cannot be larger than 11×17 or smaller than 8 1/2×11.
  • Posters must include the student’s name, grade, school, home address, and phone number on the back.
  • Posters become the property of the Narragansett Bay Commission.
  • Winners receive a $100 cash prize, winning posters are printed in NBC’s 2027 poster calendar, and winners are invited to a recognition ceremony on Wednesday, June 3rd, 2026 at 5:00 at the NBC Field’s Point Wastewater Treatment Facility at 2 Ernest Street, Providence. 
  • Mail posters to the Narragansett Bay Commission’s Public Affairs Office at One Service Road, Providence, RI 02905.
  • THE CONTEST DEADLINE IS FRIDAY, MAY 1, 2026!

We hope that your school will be able to participate in the contest! For more information, please call the NBC’s Environmental Education Coordinator at 401-443-4947.

Win a $250 Gift Card!

Want to win a $250 gift card? You can with the Narragansett Bay Commission AutoPay and paperless e-billing sweepstakes! To enter, visit www.narrabay.com/customer-care/pay-bill/ and log into your account. Enroll in either AutoPay or paperless e-billing and you’re in. Current users will automatically be entered.  

The sweepstakes runs from November 1, 2025 – January 31,2026, making it the perfect way to get your new year started right. Enroll and enter today.  

NBC Welcomes New CFO

Kevin McDonald has joined the Narragansett Bay Commission as Chief Financial Officer, where he will oversee the agency’s $302 M annual budget, which includes significant infrastructure investments such as the final phase of the agency’s Combined Sewer Overflow project. Mc Donald previously served as Director of Loan Operations for the US Army Corps of Engineers Water Infrastructure Financing Program and as a Senior Underwriter for the USEPA’s Water Infrastructure Finance and Innovation Act Program.

“We are so pleased to welcome Kevin to the NBC,” said Executive Director Laurie Horridge. “His knowledge of public finance—and the water sector specifically—will benefit both the NBC’s ratepayers and the health of Narragansett Bay. We look forward to his collaboration and innovation as we continue to deliver on our clean water mission.”

McDonald has an undergraduate degree from Brown University in American History and a graduate degree from Harvard University in City and Regional Planning.

“Follow the Flush” with a Free Tour!

Narragansett Bay Commission Offers Free Clean Water Tours: Follow the Flush!

In celebration of Rhode Island Clean Water Week, the Narragansett Bay Commission (NBC) will offer free public tours of its award-winning Field’s Point Wastewater Treatment Facility in Providence on Saturday, April 12 from 10:00 AM to 1:00 PM.

The tours will include a look at the region’s most sophisticated water quality lab, “touch-a-truck” and “touch-a-boat” with the NBC’s maintenance and research vehicles, a clean water scavenger hunt, and other fun activities.

“This facility is simultaneously one of the oldest and most advanced clean water facilities in the nation,” said NBC Chairman Vincent Mesolella. “We’re so excited to give the public the opportunity to ‘follow the flush’ and view the process that has made Narragansett Bay cleaner than it has been in 150 years.”

In addition, the NBC will issue certificates of completion to all students who take the tour that may be redeemed for extra credit at school (but students are advised check with their teacher first).

“I am confident that anyone who experiences this tour will be amazed and appreciative by the clean water efforts in our community,” Mesolella added.

Members of the public can book a tour on the half hours between 10:00 AM and 1:00 PM by emailing nbcpr@narrabay.com. Spaces are limited. The tour will take approximately 90 minutes.

The NBC joins four other clean water agencies in Rhode Island offering free public tours during Rhode Island Clean Water Week. Information on other tours is available at ricwa.org

August 10 – August 16, 2026

Walker Point

Sondes were swapped this week on August 12th. Overall, water quality at Walker Point was poor to good this week. Weather conditions were mildly rainy this week, with a total of 0.26 inches recorded at T.F. Green, and the majority of rainfall occurring on the 13rd.  Blackstone River flow was highest on August 10th, where the flow slightly exceeded the 20-year daily median flow, and flow declined over the rest of the week, falling below the 20-year daily median value. Salinity at the surface averaged 21.8 ppt and ranged from 11.0 ppt to 27.9 ppt. At the bottom, salinity averaged 26.5 ppt and ranged from 23.4 ppt to 28.5 ppt. Temperatures this week averaged 25.3 °C at the surface and 24.7 °C at the bottom. Surface temperatures ranged from 23.2  °C to 27.7 °C, while bottom temperatures ranged from 23.8 °C to 25.8 °C.

Dissolved oxygen (DO) at Walker Point remained above the hypoxia threshold (i.e., DO >2.9 mg/L) at the surface, but below the hypoxia threshold at the bottom for much of the time, especially towards the beginning of the week. Hypoxic conditions were observed at the surface briefly during the mornings of August 10th, August 12th, August 14th, August 15th, and August 16th. Hypoxic conditions were observed at the bottom for almost the entirety of August 10th and 11th, and in intermittent periods for the rest of the week. Surface DO averaged 7.3 mg/L and ranged from 2.5 to 15.6 mg/L. Bottom water DO concentration averaged 2.7 mg/L and ranged from 0.1 mg/L to 8.4 mg/L. Chlorophyll ranged from low to elevated levels throughout the week, averaging 12.2 ug/L at the surface and 16.4 ug/L at the bottom, with evidence of substantial phytoplankton blooms occurring throughout the week. Maximum surface chlorophyll readings reached 113.0 ug/L on the afternoon of August 13th. Please note that tidal fluctuations and Blackstone River flows greatly influence water column salinity, temperature, and DO at this location.

Bullock Reach

Overall, water quality ranged from poor to good at Bullock Reach this week. Salinity averaged 27.2 ppt, 29.5 ppt, and 31.5 ppt at the surface, middle, and bottom sondes, respectively. Surface salinity ranged from 22.1 to 29.1 ppt, mid salinity ranged from 26.7 to 31.1 ppt, and bottom salinity ranged from 28.2 to 32.4 ppt. Surface temperature averaged 25.3 °C and ranged from 24.0 °C to 27.2 °C. Mid temperatures averaged 24.4 °C and ranged from 23.1 °C to 26.0 °C. Bottom temperatures averaged 23.3 °C and ranged from 22.3 °C to 24.8 °C.

DO at Bullock Reach experienced hypoxic conditions (i.e., DO < 2.9 mg/L) towards the beginning of  the week in both middle and bottom waters. Surface DO averaged 7.2 mg/L and ranged from 3.8 to 11.3 mg/L. In the mid waters, DO averaged 4.4 mg/L and ranged from 1.6 to 8.2 mg/L. At the bottom, DO averaged 3.2 mg/L and ranged 2.0 to 5.7 mg/L.  Chlorophyll readings ranged from low to moderate, with evidence of moderate phytoplankton blooms occurring throughout the week. Readings averaged 12.3 µg/L at the surface, 11.6 µg/L at mid-depth, and 6.7 µg/L at the bottom.  The maximum surface chlorophyll was 44.7 µg/L on the afternoon of August 12th.

August 3 – August 9, 2026

Walker Point

Overall, water quality at Walker Point was poor this week. Weather conditions were rainy this week, with a total of 2.52 inches recorded at T.F. Green, and the majority of rainfall occurring on the 3rd.  Blackstone River flow reached its peak on August 4th, where the flow greatly exceeded the 20-year daily median flow, and flow remained above the 20-year daily median value for the rest of the week.   Salinity at the surface averaged 11.3 ppt and ranged from 3.6 ppt to 22.5 ppt. At the bottom, salinity averaged 24.3 ppt and ranged from 18.4 ppt to 28.5 ppt. Temperatures this week averaged 26.0 °C at the surface and 24.4 °C at the bottom. Surface temperatures ranged from 23.7  °C to 29.8 °C, while bottom temperatures ranged from 23.7 °C to 25.4 °C.

Dissolved oxygen (DO) at Walker Point remained above the hypoxia threshold (i.e., DO >2.9 mg/L) at the surface, but below the hypoxia threshold at the bottom for most of the week. Hypoxic conditions were observed at the surface briefly during the morning on August 3rd. Hypoxic conditions were observed at the bottom for almost the entire week. Surface DO averaged 9.5 mg/L and ranged from 2.8 to 19.3 mg/L. Bottom water DO concentration averaged 1.6 mg/L and ranged from 0.1 mg/L to 3.9 mg/L. Chlorophyll ranged from low to elevated levels throughout the week, averaging 18.0 ug/L at the surface and 3.5 ug/L at the bottom, with evidence of substantial phytoplankton blooms occurring throughout the week. Maximum surface chlorophyll readings reached 157.4 ug/L on the morning of August 9th. Please note that tidal fluctuations and Blackstone River flows greatly influence water column salinity, temperature, and DO at this location.

Bullock Reach

Sondes were swapped this week on August 4th. Overall, water quality ranged from fair to good at Bullock Reach this week. Salinity averaged 23.8 ppt, 28.0 ppt, and 31.1 ppt at the surface, middle, and bottom sondes, respectively. Surface salinity ranged from 19.9 to 28.7 ppt, mid salinity ranged from 24.1 to 31.0 ppt, and bottom salinity ranged from 28.7 to 32.3 ppt. Surface temperature averaged 26.1 °C and ranged from 24.1 °C to 28.5 °C. Mid temperatures averaged 24.7 °C and ranged from 23.1 °C to 27.0 °C. Bottom temperatures averaged 23.2 °C and ranged from 22.3 °C to 24.7 °C.

DO at Bullock Reach experienced hypoxic conditions (i.e., DO < 2.9 mg/L) towards the end of  the week in both middle and bottom waters. Surface DO averaged 8.1 mg/L and ranged from 4.9 to 14.2 mg/L. In the mid waters, DO averaged 4.9 mg/L and ranged from 1.1 to 8.4 mg/L. At the bottom, DO averaged 3.6 mg/L and ranged 1.8 to 7.4 mg/L.  Chlorophyll readings ranged from low to moderate, with evidence of moderate phytoplankton blooms occurring throughout the week. Readings averaged 15.5 µg/L at the surface, 14.8 µg/L at mid-depth, and 4.9 µg/L at the bottom.  The maximum surface chlorophyll was 37.2 µg/L on the afternoon of August 5th.

July 27 – August 2, 2026

Walker Point

Sondes were swapped this week on July 28th. Overall, water quality at Walker Point was poor this week. Weather conditions were rainy this week, with a total of 1.25 inches recorded at T.F. Green, and the majority of rainfall occurring on the 29th.  Blackstone River flow reached its peak on July 30th, where the flow greatly exceeded the 20-year daily median flow, and flow remained above the 20-year daily median value for the rest of the week.   Salinity at the surface averaged 17.7 ppt and ranged from 7.5 ppt to 27.4 ppt. At the bottom, salinity averaged 26.7 ppt and ranged from 21.6 ppt to 29.4 ppt. Temperatures this week averaged 24.2 °C at the surface and 26.2 °C at the bottom. Surface temperatures ranged from 22.4  °C to 26.2 °C, while bottom temperatures ranged from 22.6 °C to 24.6 °C.

Dissolved oxygen (DO) at Walker Point remained above the hypoxia threshold (i.e., DO >2.9 mg/L) at the surface, but below the hypoxia threshold at the bottom for a substantial portion of the week. Hypoxic conditions were observed at the bottom for most of July 27th, 28th, August 1st, and August 2nd. Hypoxic conditions occurred intermittently on other days of the week. Surface DO averaged 7.7 mg/L and ranged from 3.5 to 15.1 mg/L. Bottom water DO concentration averaged 2.5 mg/L and ranged from 0.5 mg/L to 6.1 mg/L. Chlorophyll ranged from low to elevated levels throughout the week, averaging 16.2 ug/L at the surface and 5.6 ug/L at the bottom, with evidence of moderate phytoplankton blooms occurring throughout the week. Maximum surface chlorophyll readings reached 66.4 ug/L on the afternoon of August 2nd. Please note that tidal fluctuations and Blackstone River flows greatly influence water column salinity, temperature, and DO at this location.

Bullock Reach

Sondes were swapped this week on August 4th. Overall, water quality ranged from por to good at Bullock Reach this week. Salinity averaged 27.9 ppt, 29.5 ppt, and 31.0 ppt at the surface, middle, and bottom sondes, respectively. Surface salinity ranged from 24.9 to 29.6 ppt, mid salinity ranged from 29.5 to 31.5 ppt, and bottom salinity ranged from 27.3 to 32.5 ppt. Surface temperature averaged 23.9 °C and ranged from 22.8 °C to 25.4 °C. Mid temperatures averaged 23.5 °C and ranged from 21.5 °C to 24.8 °C. Bottom temperatures averaged 22.5 °C and ranged from 20.2 °C to 24.1 °C. DO at Bullock Reach experienced hypoxic conditions (i.e., DO < 2.9 mg/L) towards the beginning of  the week in bottom waters, but otherwise did not experience hypoxic conditions. Surface DO averaged 7.2 mg/L and ranged from 5.0 to 11.4 mg/L. In the mid waters, DO averaged 5.9 mg/L and ranged from 3.3 to 9.1 mg/L. At the bottom, DO averaged 4.3 mg/L and ranged 2.2 to 7.6 mg/L.  Chlorophyll readings ranged from low to moderate, with evidence of moderate phytoplankton blooms occurring throughout the week. Readings averaged 10.1 µg/L at the surface, 13.0 µg/L at mid-depth, and 4.5 µg/L at the bottom.  The maximum surface chlorophyll was 26.8 µg/L on the afternoon of August 2nd.

September 2, 2026

Water clarity was measured at eight locations in the Providence River and Seekonk River estuaries on September 2, 2026. In the five days prior to the survey, 1.25 inches of precipitation were recorded at TF Green. Secchi depth averaged 2.6 meters. The lowest clarity this week (2.3 meters) was measured at Phillipsdale Landing, while the greatest clarity (2.7 meters) was observed at Bullock Reach, Conimicut Point, and Edgewood Yacht Club. There was no clear north-to-south gradient in water clarity among the sites this week. Overall, water clarity increased from the previous measurements (data collected August 26, 2026).

August 19, 2026

Nutrient samples were collected from six river stations and seven bay stations on August 19th. All bay stations were sampled at the surface and bottom. In the five days prior to sampling, 0.13” of precipitation were recorded at T.F. Green.

Among the river stations sampled, the highest total nitrogen (TN), total dissolved nitrogen (TDN), and dissolved inorganic nitrogen (DIN) were observed at Pawtuxet River @ Broad St. (TN = 1,600 ppb, TDN = 1,240 ppb, DIN = 956.2 ppb). The lowest TN was observed at Moshassuck River @ Footbridge at Mill St. (749 ppb). The lowest TDN and DIN were observed at Moshassuck River @ Higginson Ave (TDN = 685 ppb, DIN = 547.0 ppb).

Among the bay stations sampled, the highest surface total nitrogen (TN) was observed at Phillipsdale Landing (2690 ppb). The highest surface total dissolved nitrogen (TDN) and dissolved inorganic nitrogen (DIN) were observed at Pawtuxet Cove (TDN = 885 ppb, DIN = 535.8 ppb). The lowest surface TN was observed at Bullock Reach (523 ppb). The lowest surface TDN was observed at Edgewood Yacht Club (186 ppb). The lowest DIN was observed at Phillipsdale Landing (38.0 ppb).

The next scheduled sampling date is September 2nd, 2026.

August 5, 2026

Nutrient samples were collected from twelve river stations and eight bay stations on August 5th. All bay stations were sampled at the surface; Edgewood Shoal was sampled at the surface and bottom. In the five days prior to sampling, 2.57” of precipitation were recorded at T.F. Green.

Among the river stations sampled, the highest total nitrogen (TN), total dissolved nitrogen (TDN), and dissolved inorganic nitrogen (DIN) were observed at Ten Mile River @ Central Ave (TN = 1,010 ppb, TDN = 1,150 ppb, DIN = 789.8 ppb). The lowest TN and TDN were observed at Ten Mile River @ Roger Williams Ave (TN = 516 ppb, TDN = 442 ppb). The lowest DIN was observed at Palmer River @ Rt 6 (85.6 ppb).

Among the bay stations sampled, the highest surface total nitrogen (TN) and total dissolved nitrogen (TDN) were observed at Phillipsdale Landing (TN = 2,560 ppb, TDN = 1,000 ppb). The highest surface dissolved inorganic nitrogen (DIN) was observed at Pawtuxet Cove (504.0 ppb). The lowest surface TN was observed at Pomham Rocks (651 ppb). The lowest surface TDN and DIN were observed at Bullock Reach (TDN = 158 ppb, DIN = 86.6 ppb).

The next scheduled sampling date is August 19th, 2026.

August 26, 2026

Water clarity was measured at seven locations in the Providence River and Seekonk River estuaries on August 26, 2026. In the five days prior to the survey, 0.73 inches of precipitation were recorded at TF Green. Secchi depth averaged 2.1 meters. The lowest clarity this week (1.5 meters) was measured at Pomham Rocks, while the greatest clarity (2.9 meters) was observed at India Point Park. There was no clear north-to-south gradient in water clarity among the sites this week. Overall, water clarity decreased from the previous measurements (data collected August 19, 2026).

August 26, 2026

Water column profiles were conducted using a Seabird Electronics profiler at six locations in the Providence River and one location in the Seekonk River on August 26, 2026. In the five days leading up to this, there were 0.73 inches of rain recorded at T.F. Green International Airport (Warwick, RI). Strong water column stratification was observed at Edgewood Yacht Club and Phillipsdale Landing. The water column was moderately stratified at Pomham Rocks. Bullock Reach, Conimicut Point, and India Point Park exhibited weak stratification. The water column at Pawtuxet Cove was well mixed.

Dissolved oxygen conditions below the hypoxia threshold (2.9 mg/L) were observed in the lower part of the water column at Bullock Reach, Conimicut Point, Pomham Rocks, India Point Park and Phillipsdale Landing had dissolved oxygen conditions below the hypoxia threshold (2.9 mg/L). The highest fluorescence reading was observed one meter below the surface at Pawtuxet Cove.

August 5, 2026

Phytoplankton samples were collected on August 5, 2026 at Bullock Reach and analyzed in the laboratory shortly after collection.

The water temperature was 25.39 °C, the salinity was 21.83 psu, and the chlorophyll a was 18.18 ug/L.

It was clear, hot and sunny with murky water on this day. The qualitative tow net sample had a long filtration time. The filtrate was mostly clear with some suspended particulates and algae.

The analysis of the quantitative whole water sample revealed a total of 1,750,000 cells/L. The microflagellates were found at 146,000 cells/L. The most predominant phytoplankton genera were Skeletonema spp. at 980,000 cells/L, Eutreptiella spp. at 282,000 cells/L, and Chaetoceros spp. at 164,000 cells/L.

200x phase contrast image of Ebria spp.

Ebria spp. are phagotrophic flagellates which are present in marine coastal phytoplankton communities worldwide. The cells are solitary and hemispherical in shape. They have a distinctive internal silica skeleton with three main openings and two flagella..

August 26, 2026

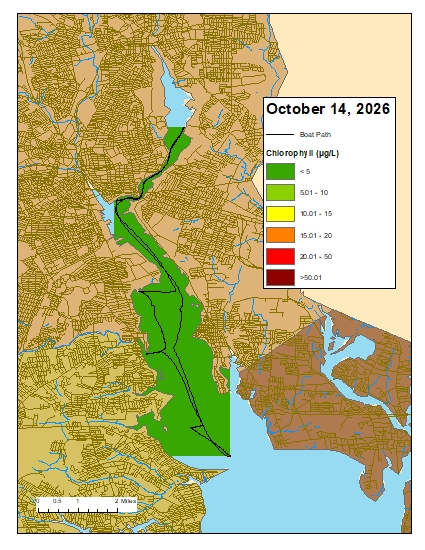
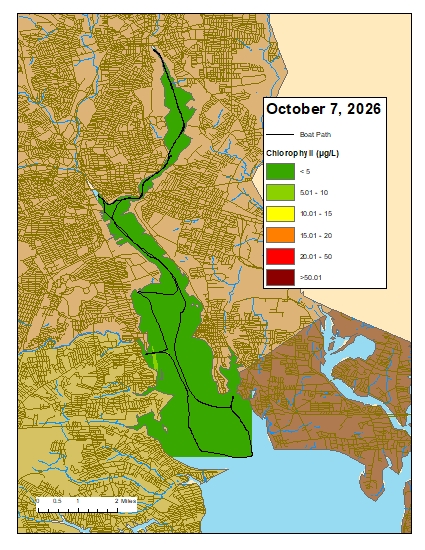
Surface chlorophyll data were collected on August 26, 2026, while the R/V Data Stream was underway collecting bacteria samples in the Providence and Seekonk River Estuaries. The average chlorophyll concentrations were categorized as fair overall with all areas sampled having average chlorophyll concentrations between 5 µg/L and 20 µg/L. Overall, chlorophyll ranged from 2.23 µg/L to 172.72 µg/L with an average of 11.20 µg/L. The chlorophyll concentrations from this date are presented in the map below using Inverse Distance Weighting (IDW) interpolation.

Scroll to Top